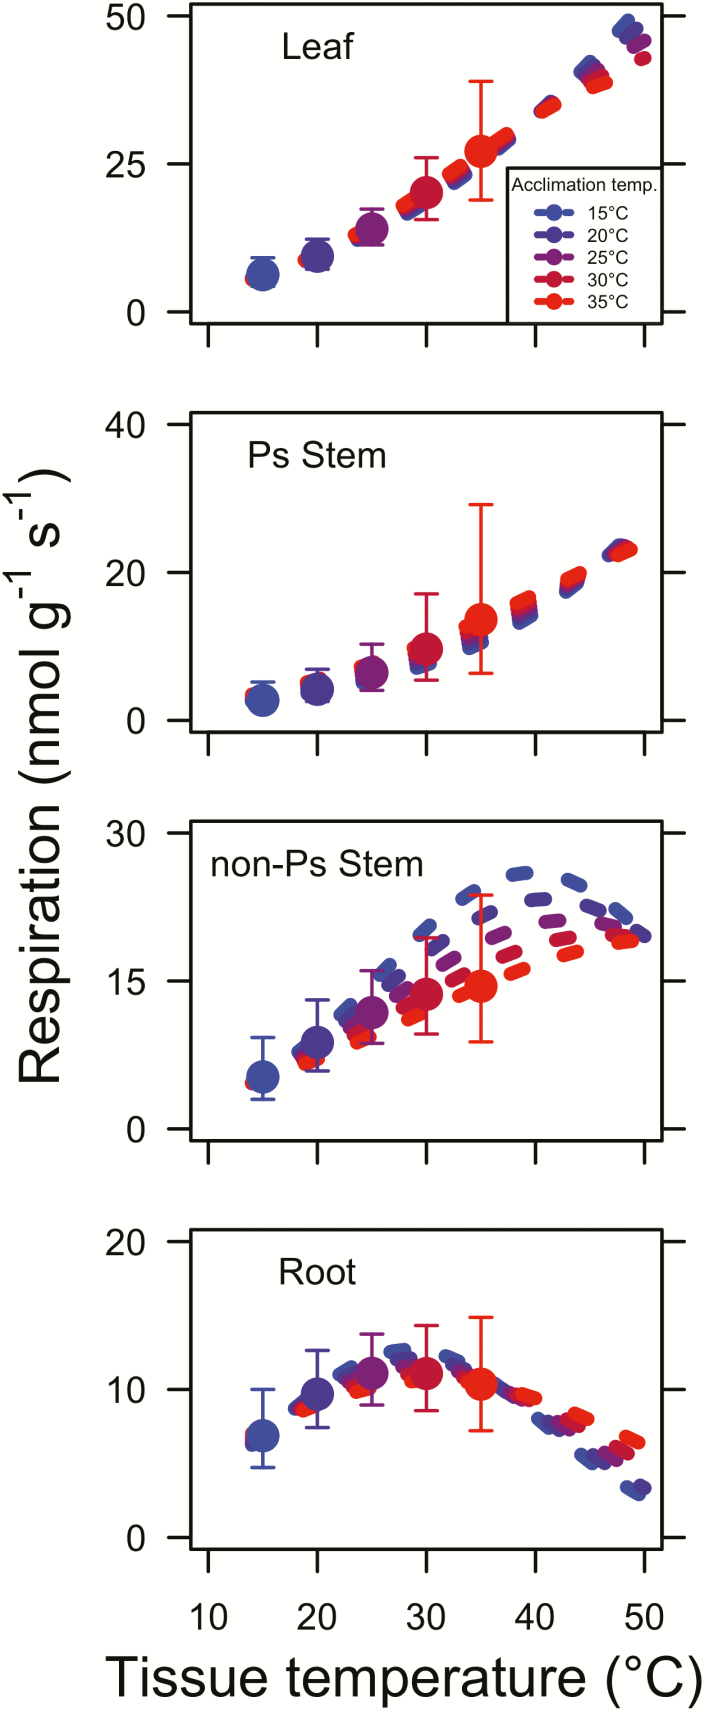
Figure 2.
The instantaneous temperature response of leaf, photosynthetic (Ps) stem, non-photosynthetic stem and root respiration. Instantaneous curves were created using the parameters obtained in Table 3. Points indicate least squared mean (±SE) values for respiration rates measured at leaf temperatures Ta equal to the tissue temperature. Throughout, blue, blue-purple, purple, red-purple and red points and lines indicate values for plants acclimated to 15, 20, 25, 30 and 35 °C, respectively (see inset legend in top panel).

