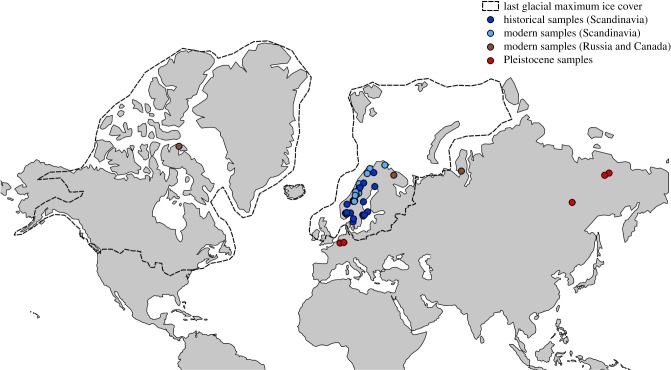
Figure 1.
Geographical distribution of the samples used in this study. Light and dark blue dots represent modern and historical samples, respectively. Red dots represent Pleistocene samples and brown dots represent modern samples from Canada and Russia. Striped black lines represent the ice cover during the last glacial maximum [42]. (Online version in colour.)

