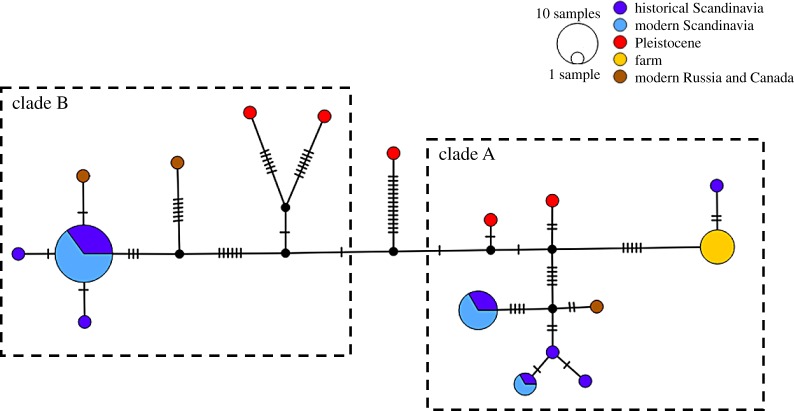
Figure 3.
Median-joining haplotype network based on 3954 bp of the mitogenome. Small crossing bars represent mutations between haplotypes. Colours correspond to sample population. Dotted lines indicate clade A and clade B as identified in the BEAST analysis (figure 2). (Online version in colour.)

