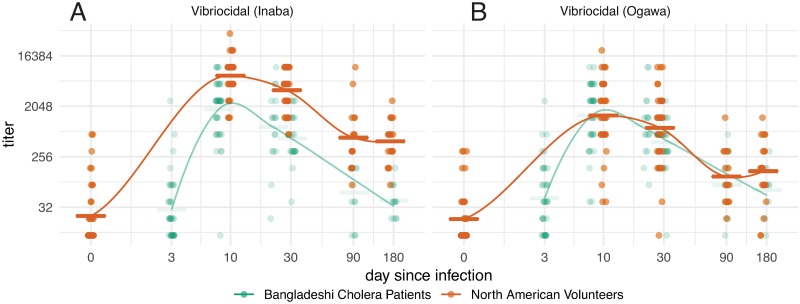
Fig 3. Vibriocidal responses over time in North American volunteers (orange) and Bangladeshi cholera patients (green).
Dots represent individual responses at each time since infection (jittered) for vibriocidal titers to Inaba (A) and Ogawa (B) serotypes. Initial data points for Bangladeshi samples assigned day 3 from presumed date of infection. Lines represent LOESS curve fit to response data from each group and horizontal bars represent the geometric mean titer for each time point. Please refer to Supplemental S5 Fig for detailed statistical comparisons among values.

