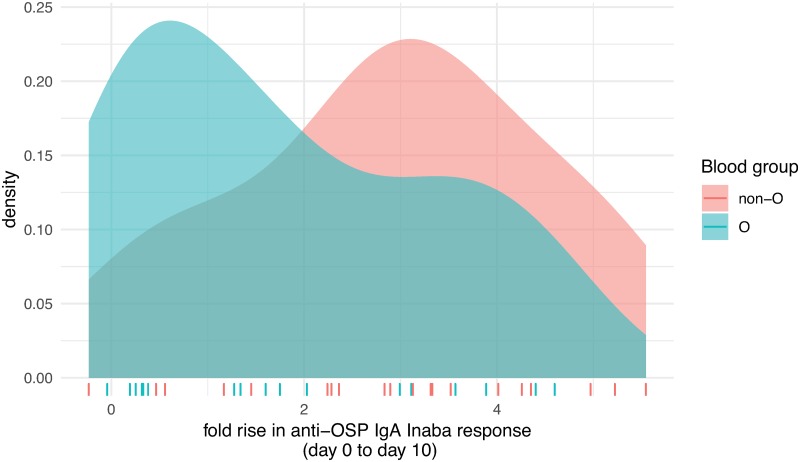
Fig 4. Fold-changes of anti-Inaba OSP IgA responses by O versus non-O blood group status.
Distribution of fold-changes of anti-Inaba OSP IgA responses from pre-infection to day 10 following experimental infection of North American volunteers with V. cholerae O1 by O versus non-O blood group status. Colored ticks on x-axis illustrate the values of the fold-change for each participant.

