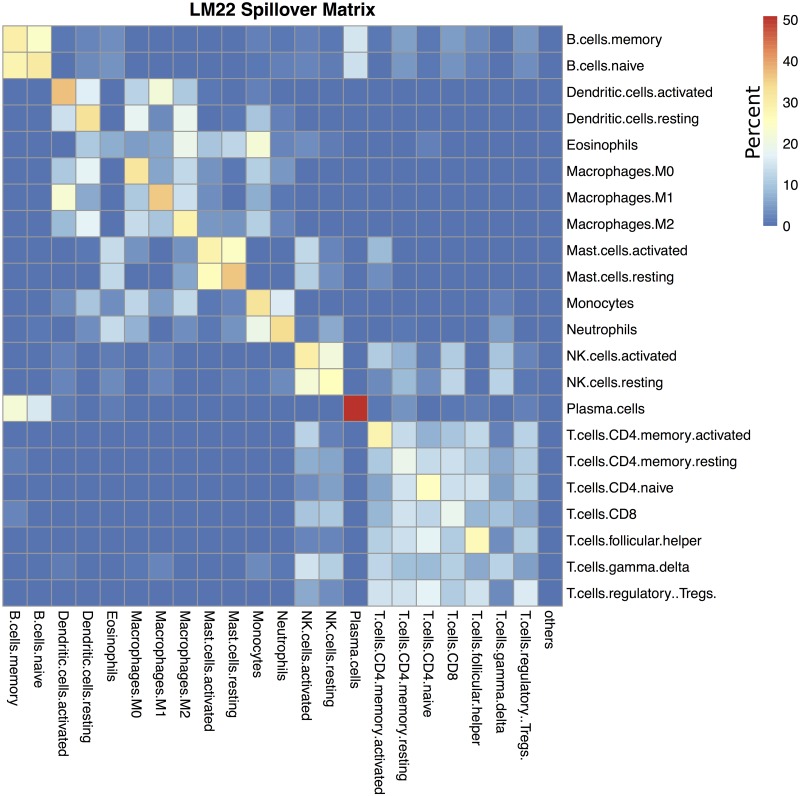
Fig 3. LM22 spillover matrix.
Spillover matrix showing mean misclassification of purified samples for LM22. Rows show purified cell types and columns show what those samples deconvolve as. Cells are colored by percentage, such that each row adds up to 100%. For example, if the row is ‘B.cell.memory’, the column is ‘Plasma.cells’, then the color is light blue indicating that purified ‘B.cell.memory’ samples deconvolve as containing (on average) 18% ‘Plasma.cells’.

