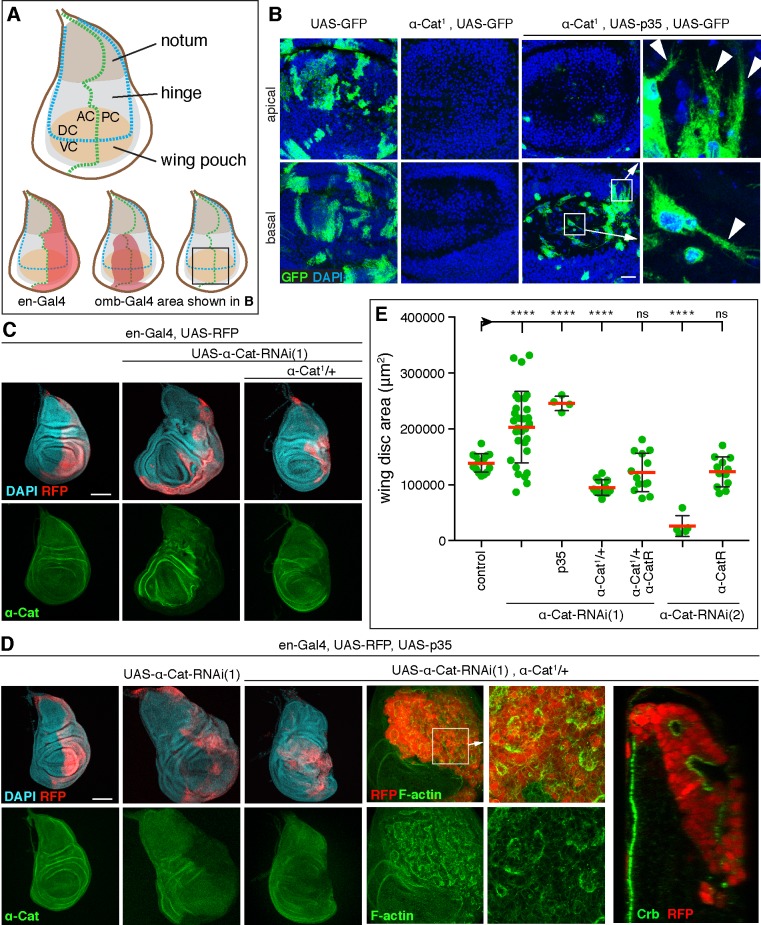
Fig 1. A phenotypic series for α-Cat reveals distinct roles in growth regulation and epithelial polarity.
(A) Schematic of 3rd larval instar wing imaginal disc. Indicated are the main subdivisions of the disc proper, the compartment boundaries (AC, anterior compartment; PC posterior compartment; DC, dorsal compartment; VC, ventral compartment), the expression domains of the en-Gal4 and omb-Gal4 drivers used in this study, and the area of the discs shown in (B). (B) Late 3rd larval instar wing discs with control (left two panels) or α-Cat1 null mutant clones positively labeled with GFP. In contrast to control clones, α-Cat1 mutant clones are not observed. When cell death is suppressed through expression of p35, α-Cat1 mutant cells are found basal to the epithelium and show extensive protrusive activity (arrowheads in close-ups). Scale bar, 25 μm. (C) KD of α-Cat in the PC (marked by RFP) with α-Cat-RNAi(1) causes tissue overgrowth, whereas KD of α-Cat in the PC with α-Cat-RNAi(1) in the presence of one copy of α-Cat1 causes a degeneration of the PC. Scale bar, 100 μm. (D) KD of α-Cat in the PC (marked by RFP) with α-Cat-RNAi(1) while expressing p35 causes tissue overgrowth, whereas KD of α-Cat in the PC with α-Cat-RNAi(1) while expressing p35 in the presence of one copy of α-Cat1 causes the formation of a multilayered tumor mass with small epithelial vesicles or patches. Apical domain of epithelial cells marked by enrichment of F-actin and Crb. Scale bars, 100 μm. (E) Quantification of wing disc area in flies of indicated genotypes. Two-tailed, unpaired t-test used to determine statistical significance. ns (P>0.05), ****(P≤0.0001).

