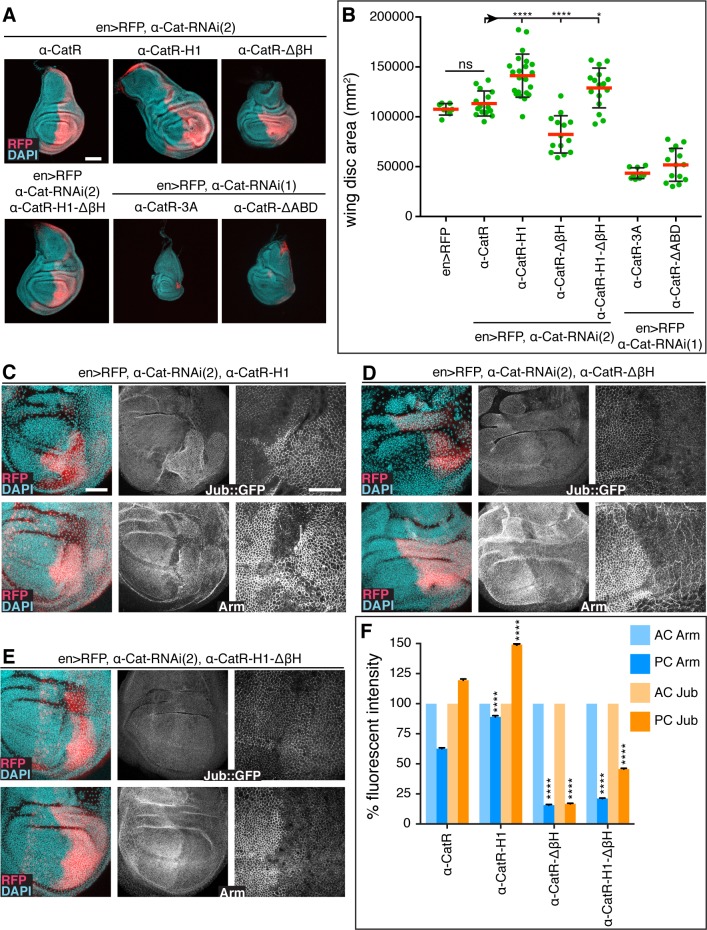
Fig 8. The mechanosensory α1-helix of the α-Cat ABD regulates tissue growth.
(A, B) Sample discs (A) and quantification of disc area (B) of late 3rd larval instar wing discs of the indicated genotypes. Note that UAS-α-CatR-H1 expression in en-Gal4, UAS-α-Cat-RNAi(2) discs causes hyperplastic overgrowth. α-CatR-3A and α-CatR-ΔABD expression enhanced the phenotype of en>α-Cat-RNAi(1) discs. 3rd larval discs expressing α-CatR-3A in a en>α-Cat-RNAi(2) background did not develop. Two-tailed, unpaired t-test; ****(P≤0.0001), *(P = 0.0148), ns (P>0.05). Scale bars, 100 μm. (C-E) Late 3rd larval instar discs expressing en-Gal4, UAS-RFP, UAS-α-Cat-RNAi(2) and either UAS-α-CatR-H1 (C), UAS-α-Cat-ΔβH (D), or UAS-α-CatR-H1-ΔβH (E). Discs express Jub::GFP controlled by its endogenous promoter (upper panels) and are stained for Arm (lower panels). Nuclei are labeled with DAPI. Close-up images to the right show wing pouch area on both sides of the anterior-posterior compartment boundary. Scale bars, 50 μm and 25 μm. (F) Comparison of relative fluorescent intensities between AC and PC for Jub::GFP (N = 500–1000 cells from five wing discs) and Arm (N = 500–1000 cells from three to four wing discs). AC values were normalized to 100%. Mann Whitney test was used to determine statistical significance comparing experimental to control (α-CatR) discs. ****(P≤0.0001).

