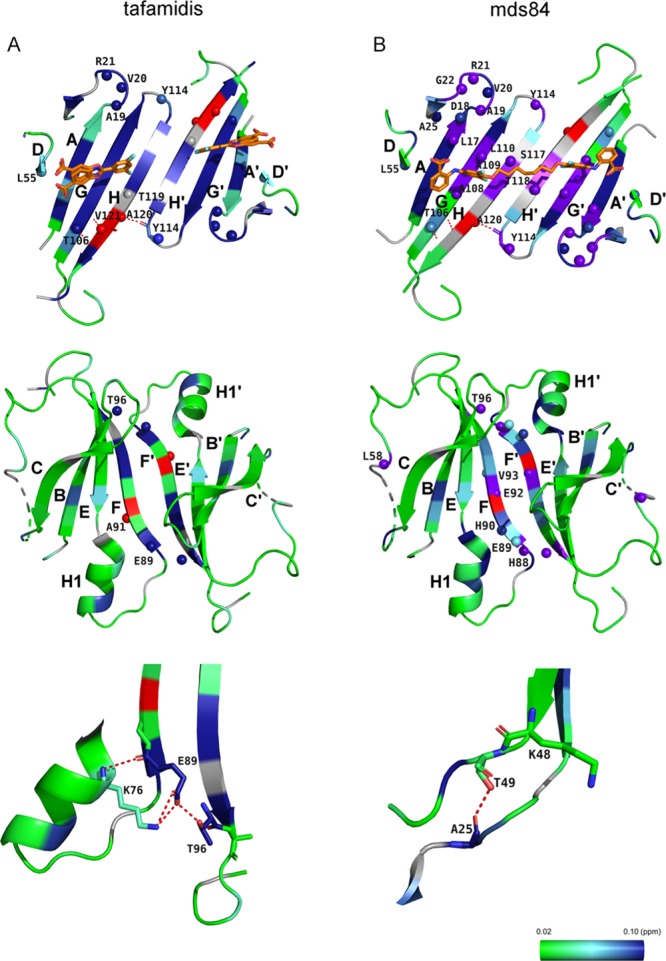
Figure 6.

Structural effects of bound tafamidis and mds84 at 2:1 and 1:1 molar ratios to TTR, respectively. (A) Effects of tafamidis on residues within the protein central β-sheet (upper panel) and in its external surface (middle panel). The lower panel illustrates a network of H-bonds between K76, E89 of chain A and T96 of chain B. (B) Effects of mds84 on residues within the protein central β-sheet (upper panel) and in its external surface (middle panel). The lower panel illustrates the H-bond between A25 and T49. A green-light blue-blue gradient depicts the extent of chemical shift change and those that become visible only once the ligand is bound are shown in red. Purple spheres represent amides that disappear only upon binding. When no information is available, the residues are shown in gray. The PDB codes are 3TCT for the TTR complex with tafamidis and 3IPE with mds84.
