
Figure 4:
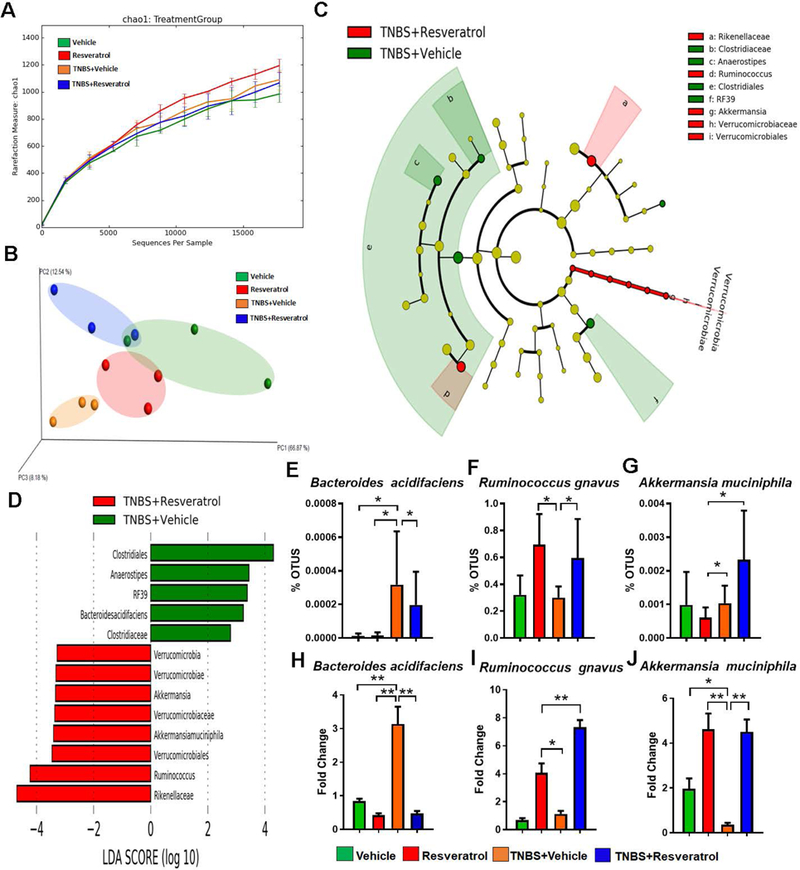
16S rRNA gene sequencing analysis. The study was designed as described in Fig 1 legend. Gut microbiome samples were collected from experimental groups by performing cecal flushes. Genomic DNA was isolated and V3-V4 regions of 16S rRNA gene subunit were sequenced. Three randomly selected mice from each group (n=3) were used for these experiments. All sequencing samples were analyzed using Nephele software 16S metagenomics provided at Nephele website (nephele.niaid.nih.gov). Alpha diversity (A), and Beta diversity (B) are depicted. LeFSe analysis of the Nephele OTU output files generated the cladogram (C) and LDA score bar graph (D) depicting microbial biomarkers among TNBS+Vehicle vs. TNBS+RES groups. OTU percent abundances are shown for the species Bacteroides acidifaciens (E) Ruminococcus gnavus (F) and Akkermansia muciphila (G). Validation of these significantly-altered bacterial species were performed using PCR and the fold changes are calculated using the delta-delta CT method with comparison to Vehicle controls (H-J). For 16S rRNA gene sequencing, 3 representative cecal flushes from each experimental group were processed and sequenced. For PCR validation, 10 mice were used in each group and fold changes were calculated using the delta-delta CT method compared to Vehicle control. Significance (p-value: *<0.05, **<0.01, ***<0.005, ****<0.001) was determined by using one-way ANOVA followed by Tukey’s post-hoc multiple comparisons test. Experiments are representative of 3 independent experiments.