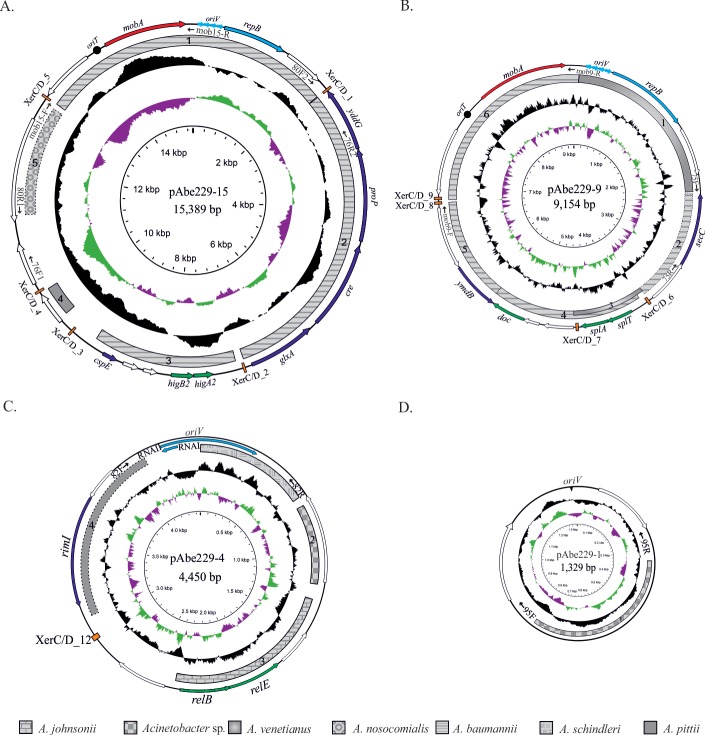
Fig 2.
Schematic representation of plasmids pAbe229-15 (A), pAbe229-9 (B), pAbe229-4 (C) and pAbe229-1 (D). The regions encoding RNAI- and RNAII-homologous sequences in pAbe229-4 are highlighted in light blue, and the direction of transcription is also indicated in each case. In pAbe229-1, the dark triangle denotes a high-AT region (putative oriV) predicted on the basis of the cumulative GCskew (see the text). Plasmids are not drawn to scale. For details, see the legend to Fig 1.

