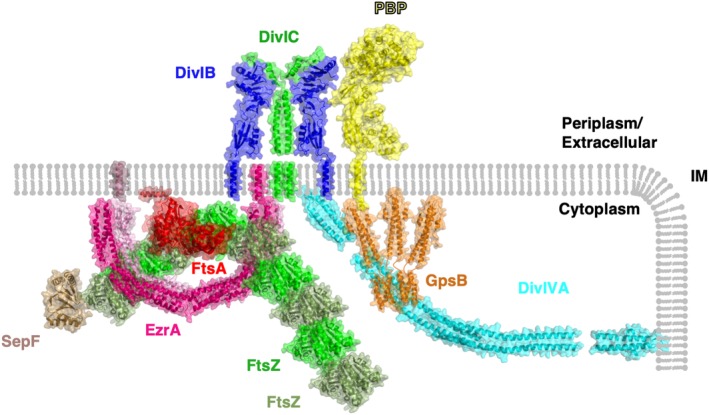
Figure 4.

Structural model of the divisome. A selection of divisome proteins for which atomic structures have been determined are shown in context of the cell membrane (IM). Where structural data regarding protein–protein interactions are known, this figure reflects this information. Where available, structures have been taken from the model organism B. subtilis; however, in the cases where there is a lack of structural data from this organism, the structures with the greatest degree of sequence homology are shown. FtsZ is colored alternately in shades of green to denote filament formation, FtsA is shown in red, an antiparallel EzrA dimer is colored in shades of pink, SepF is shown in sand (note that the membrane‐anchoring region of SepF was not resolved in its crystal structure analysis), a 2:2 complex of DivIB and DivIC is shown in blue and green, respectively, a GpsB hexamer is shown in orange, a representative class B PBP is shown in yellow and DivIVA in cyan
