
Figure 2.
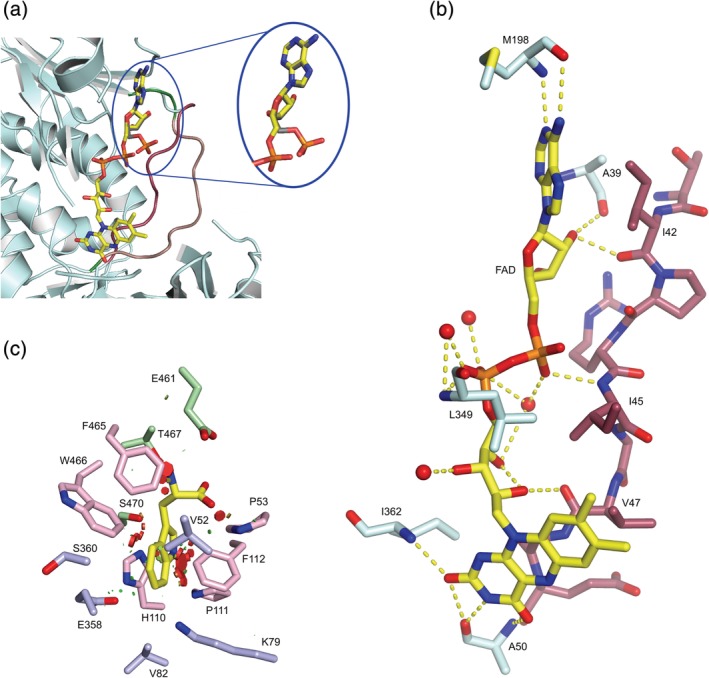
Conformational change of the FAD loop and details of substrate‐binding site. (a) Overlay of the FAD‐binding site of FAD‐Thal (pale cyan and dark red) and the FAD loop of chain A of Trp‐FAD‐Thal (salmon). The cofactor FAD is shown with carbons in yellow and AMP with carbons in grey. The FAD loop is highlighted in dark red in the closed state and in salmon in the open state. In chain A of the Trp‐FAD‐Thal structure, the phosphate of AMP points out of the FAD‐binding site. Several residues are hidden for a better view of the FAD and AMP. (b) Hydrogen bonds between FAD (yellow) and Thal (pale cyan and dark red) or protein‐bound waters are shown as dotted yellow lines. (c) Steric conflicts upon placing l‐Trp from Trp‐Thal in FAD‐Thal. l‐Trp from Trp‐Thal chain A (PDB ID 6H44) was placed in FAD‐Thal chain A. Minor clashes are indicated as small green hexagons, more severe clashes are shown as bigger red hexagons. Clashes mainly occur between the indole moiety of l‐Trp and the side chains of the conserved residues Pro53, Phe112, Phe465, and Trp466. Conserved residues Tyr 454 and Tyr455 are not shown because the substrate‐binding loop is disordered. Coloring of the active site residues according to previously published work10