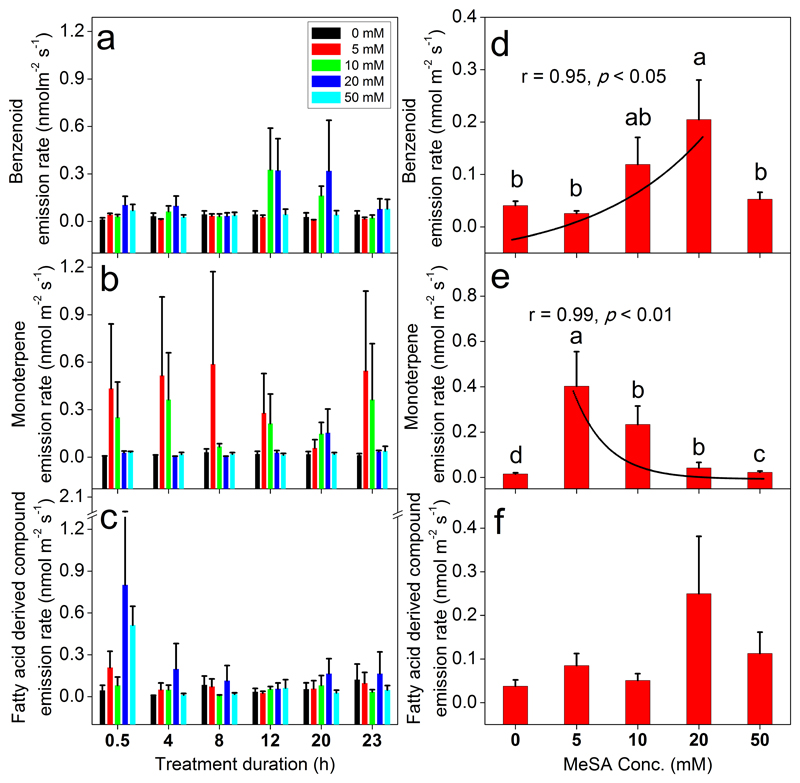
Fig. 2.
Effects of MeSA treatments on emission rates of total benzenoids (a, d), monoterpenes (b, e) and fatty acid derived compounds (c, f) of Betula pendula leaves. Treatments, number of biological replicates and statistical analyses as in Fig. 1. Effects of MeSA on individual VOCs are shown in Table 2. The effects of time and MeSA concentration × time interaction were not significant (Table 1) according to linear mixed models. Data in (d) and (e) were fitted by non-linear regressions and the corresponding regression equations are y = 0.04e0.09x (d) and y = 0.77e-0.13x (e).

