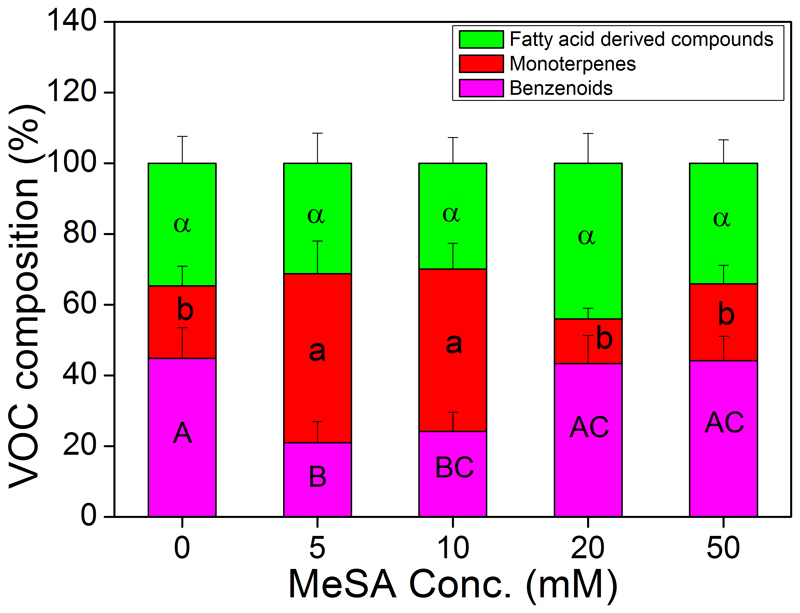
Fig. 3.
Effects of MeSA treatments on the distribution of volatiles (average ±SE percentages of total emissions) between three major compound classes: benzenoids, monoterpenes and fatty acid derived compounds in Betula pendula leaves. Data were collected from three independent biological replicates at each MeSA treatments. As indicated in Fig. 2, VOC emission rates of different compound groups did not differ through the recovery period, and thus, emission rates of all recovery times were pooled, and analyzed by one-way ANOVA followed by Fisher’s LSD test. Different letters indicate statistically significant differences at P<0.05.

