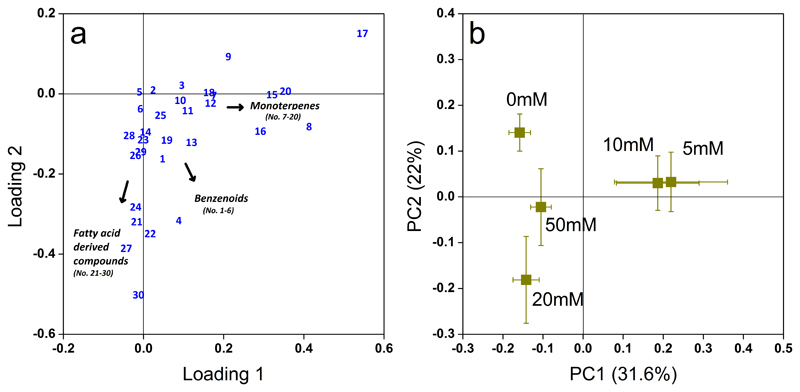
Fig. 4.
Loading plot (a) and score plot (b) of the principal component analysis (PCA) of the VOC emission profiles as affected by MeSA treatments in leaves of Betula pendula. Emission rates of all volatiles (Table 2 for compound codes) collected from three biological replicates during 23 hours after application of different concentrations of MeSA were used in the PCA analysis. In the loading plot (a), the impact of volatiles increases with the distance from the origin of the co-ordinate system. In the score plot (b), the mean scores± SE (n =3 for each treatment) of principal components (PC1 and PC2) were calculated by MetaboAnalyst version 3.0 and redrawn in OriginLab 8.0. The variation explained by each PC is shown in both axes.

