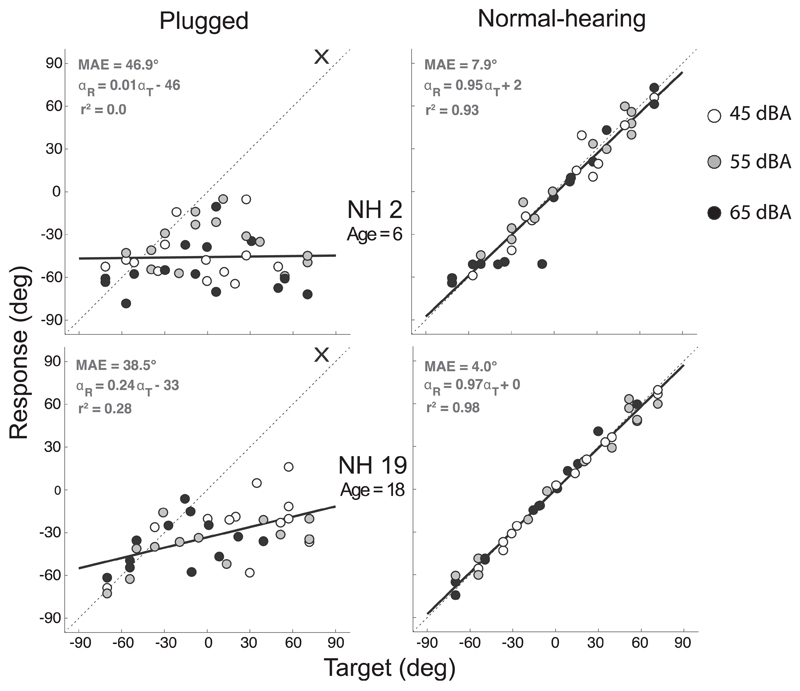
Fig. 2.
Target-response plots of two normal-hearing children (NH2, NH19). In the right column the normal-hearing condition is shown and in the left column the plugged condition (the right side is plugged - indicated by a cross). Data points represent listeners' localization response to a stimulus (white: 45 dBA, grey: 55 dBA, black: 65 dBA). Best-fit linear regression is indicated by a black line.

