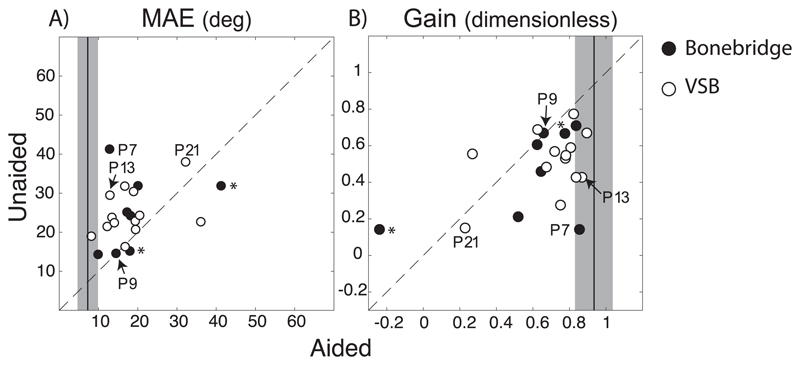
Fig. 4.
A) MAE and B) gain of aided condition (x-axis) are plotted against those of unaided condition. Black data points indicate Bonebridge listeners and white data points VSB listeners. The four listeners depicted in Fig. 3 are marked (P7, P9, P13, P21). The black vertical lines represents the mean MAE (7.3°) and mean gain (0.93) of the 26 normal-hearing listeners. The grey shaded box is the width of ± two standard deviations. Listeners marked with an asterisk (*) performed sound localization with stimuli presented at 55 dBA only (P1, P3).

