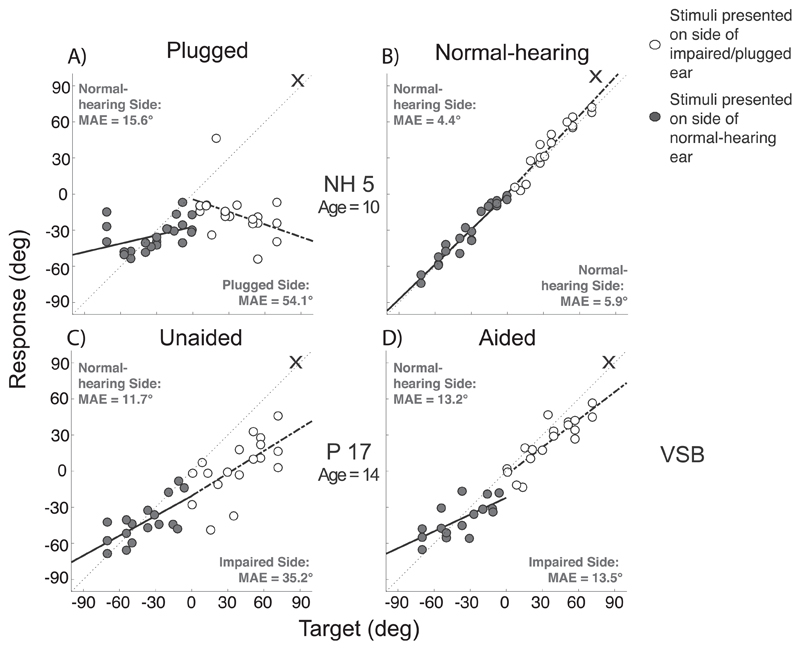
Fig. 5.
Target-response plots of a normal-hearing (NH5) and an UCHL listener (P17). In the right column the aided/normal-hearing condition (B, D) is shown and in the left column the unaided/plugged (A, C) condition. Grey data points represent stimuli presented on the normal-hearing side (left) and white on the impaired/plugged side (right – indicated by cross). Analysis was done for each side separately.

