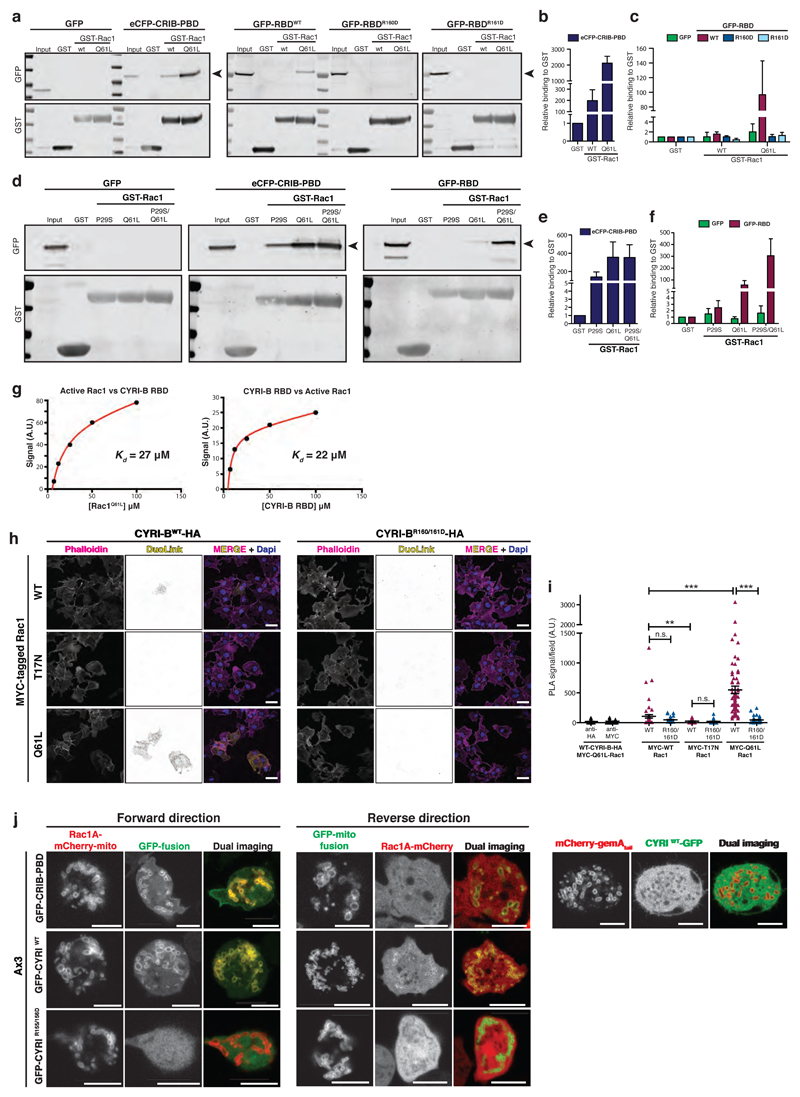
Figure 2. CYRI proteins interact with active Rac1.
a-c - Western blot images from pulldown of GST control, GST-Rac1WT or GST-Rac1Q61L immobilized on beads, mixed with cell lysate expressing either GFP alone, positive control PAK1 eCFP-CRIB-PBD, GFP-RBDWT, GFP-RBDR160D or GFP-RBDR161D (a). Binding relative to GST was quantified by densitometry (b-c).
d-f - Western blot images from pulldown of GST control, GST-Rac1P29S or GST-Rac1Q61L or the double mutant GST-Rac1P29S/Q61L immobilized on beads, mixed with cell lysate expressing either GFP alone, eCFP-CRIB-PBD, GFP-RBDWT (d). Relative binding to GST was quantified by densitometry (e-f).
g – Summary of steady state surface plasmon resonance (SPR) binding curves between Rac1Q61L and CYRI-B-RBD. Left: GST-CYRI-B was immobilized on anti-GST surface vs increasing concentrations of Rac1Q61L. Right: His-Rac1 was immobilized on NTA surface vs increasing concentrations of CYRI-B RBD. Biacore evaluation software 3.0 was used to fit a simple 1:1 binding model. Kd = equilibrium dissociation constant, A.U. = arbitrary units.
h-i Proximity ligation assay was performed on COS-7 cells plated on laminin and co-expressing either CYRI-B-HA or CYRI-BR160/161D-HA and MYC-tagged Rac1 constructs as indicated. PLA signal (yellow), F-actin (magenta) and nuclei (blue). See Supplementary Fig. 2 for negative controls. Quantification in (i). One-way ANOVA with Dunn’s post-test was performed between CYRI-BWT and the different MYC-Rac1 constructs. Mann Whitney test was tested between CYRI-BWT and CYRI-BR160/161D for each MYC-Rac1 construct. n.s. p> 0.05, ** p≤0.01, *** p≤0.001. (Cell counts: anti-HA n=55 ; anti-Myc n=54 ; Myc-WT/WT-HA n=55 ; Myc-WT/R160/161D-HA n=55 ; Myc-T17N/WT-HA n=63 ; Myc-T17N/R160/161D-HA n=84 ; Myc-Q61L/WT-HA n=69 ; Myc-Q61L/R160/161D-HA n=65) Scale bar = 50 μm.
j - Still pictures from mitochondrial recruitment of CYRI (Forward) or Rac1AP29S/Q61L (Reverse) in Ax3 D. discoideum. Quantification was performed using the co-localisation tool of Imaris. The Pearson’s coefficient of correlation for co-localisation (and standard deviation SD) at the mitochondria for Rac1A-mCherry-mito and the GFP-fusions were: CRIB-PBD 0.80 (SD: 0.20) ; CYRIWT 0.77 (SD: 0.21) ; CYRIR155/156D 0.05 (SD: 0.12). The correlation coefficients for Rac1A-mCherry and the GFP-CYRI-mito fusions were: CRIB-PBD 0.33 (SD: 0.12) ; CYRIWT 0.44 (SD: 0.19) ; CYRIR155/156D -0.23 (SD: 0.05).
Cells co-expressing a mitochondrial reporter (mCherry-gemA tail) and CYRI-GFP were also imaged (right panel), confirming the absence of mitochondrial localisation of CYRI. The correlation coefficient was -0.06 (SD: 0.15). (n=4-5 cells containing >300 mitochondria/cell).
Scale bar = 5 μm
All data presented are representative of at least 3 biologically independent experiments. Bar and scatter plots show data points with mean and S.E.M. except if stated otherwise.

