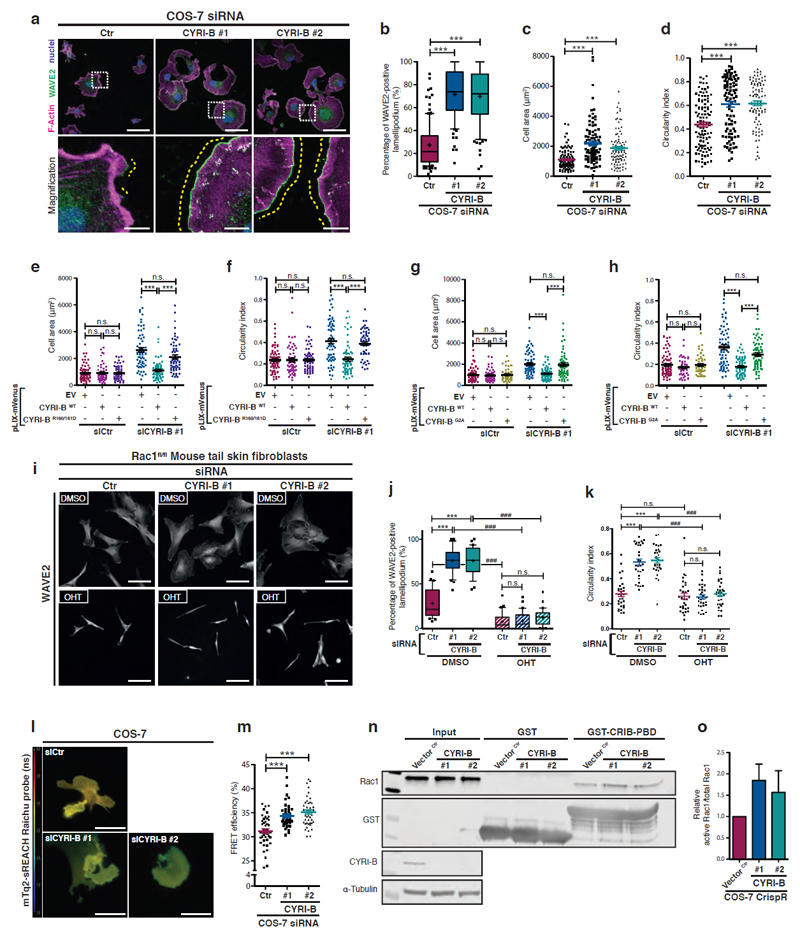
Figure 3. Loss of CYRI-B increases Rac1-mediated Scar/WAVE localisation to lamellipodia.
a-d - Immunofluorescence of control (Ctr) or cyri-b knockdown (siRNA #1 and 2) COS-7 cells plated on laminin for only 1h and stained for WAVE2 (green), nuclei (blue) and F-actin (magenta). Scale bar = 50 μm. Box insets show zoom, Scale bar = 10 μm.
The ratio of extension of WAVE2 staining (yellow dotted line) vs the total cell perimeter shown in (b) is a read-out of the extent of the cell edge devoted to lamellipodium. Manual quantification of cell area in (c) and circularity (d). One-way ANOVA with Dunn’s post-test n.s. p> 0.05, *** p≤0.001.
(a-c: Scramble n=111 ; #1 n=95 ; #2 n=96 – d: Scramble n=115 ; #1 n=92 ; #2 n=98 cells)
e-f – Rescue experiments showing COS-7 cells on laminin treated with siRNA as above and transfected with pLIX-mVenus plasmid co-expressing an siRNA resistant untagged CYRI-B (WT or R160/161D mutant) or control empty vector (EV). (see Supplementary Fig. 3l). Quantification of the cell area (e) and circularity (f) is shown. One-way ANOVA with Dunn’s post-test n.s. p> 0.05, *** p≤0.001. (Scramble/EV n=78 ; Scramble/WT n=58 ; Scramble/R160/161D n=66 ; #1/EV n=66 ; #1/WT n=64 ; #1/R160/161D n=60 cells).
g-h – Control or cyri-b knockdown COS-7 cells obtained by siRNA were transfected with the mVenus reporter plasmid (pLIX-mVenus) co-expressing a siRNA resistant untagged CYRI-B (WT or G2A mutant) or control empty vector (EV). Quantification of the cell area (g) and circularity (h). One-way ANOVA with Dunn’s post-test n.s. p> 0.05, *** p≤0.001. (Scramble/EV n=70 ; Scramble/WT n=52 ; Scramble/G2A n=46 ; #1/EV n=63 ; #1/WT n=64 ; #1/G2A n=65 cells)
i-k - Control (DMSO) or rac1 knockout (OHT) mouse tail fibroblasts treated with Scramble (siCtr) or mouse specific Cyri-B siRNA, plated on laminin and stained for WAVE2 (i). Scale bar = 50 μm. Quantification of the WAVE2 staining at the lamellipodium (j) and circularity (k) are displayed. One-way ANOVA with Dunn’s post-test *** p≤0.001. Mann Whitney test was performed between same sample treated or not with OHT. ### p≤0.001. (30 cells/conditions).
l-m - FLIM/FRET experiment with control (siCtr) or cyri-b knockdown (siCYRI-B #1 and #2) COS-7 cells transfected with mTq2-sREACH and plated on laminin. The jet2 color code (left colour bar) shows average lifetime of the probe, spanning 1-4 ns (blue to red) (l). Quantification of the FRET efficiency shown in (m). One-way ANOVA with Dunn’s post-test. *** p≤0.001. (Scramble n=61 ; #1 n=61, #2 n=63 cells)
Scale bar = 50 μm
n-o - Active Rac1 pulldown comparing control CrispR (Vector Ctr) or 2 independent cyri-b CrispR knockout (#1 and #2) COS-7 cell lines. Lysate was incubated with GST or GST-CRIB-PBD beads and western blot probed as indicated. Relative active Rac1 was quantified by densitometry (o).
All data presented are representative of at least 3 biologically independent experiments.
Bar and scatter plots show data points with mean and S.E.M.
Whisker plots show 10-90 percentile, median (bar) and mean (cross).

