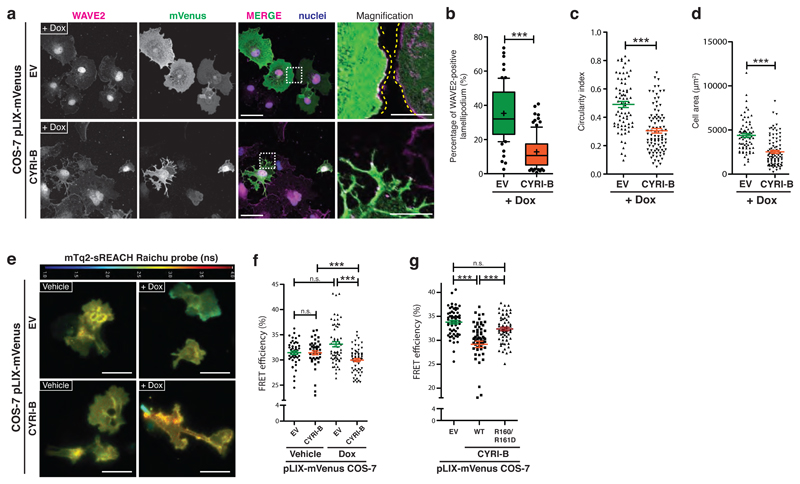
Figure 4. Overexpression of CYRI-B opposes Rac1-mediated Scar/WAVE recruitment to the leading edge.
a-d - Immunofluorescence of doxycycline-induced control empty vector (EV) or CYRI-B overexpression in COS-7 cells and fixed after a longer time (4h of spreading) and stained for WAVE2 (magenta), nuclei (blue) and GFP (green). Scale bar = 50 μm. Insets show zoom of white dashed field. Scale bar = 10 μm (a). WAVE2 ratio and circularity were measured and reported in (b) and (c) respectively. Cell area quantification was based on phalloidin staining (d). Mann-Whitney test *** p≤0.001. (Dox/EV n=73 ; Dox/CYRI-B n=93 cells)
e-f - FLIM/FRET experiment with mTq2-sREACH Raichu Rac1 showing vehicle or doxycycline-treated COS-7 cells expressing a control empty vector (EV) or CYRI-B. The jet2 color code (bar at top) shows the average lifetime of the probe, spanning 1-4 ns (blue to red) (e). Quantification of the FRET efficiency (f) Mann-Whitney test n.s. p> 0.05, *** p≤0.001. (Veh/EV n=47 ; Veh/CYRI-B n=46 ; Dox/EV n=62 ; Dox/CYRI-B n=62 cells)
Scale bar = 50 μm.
g - FRET efficiency obtained from control (EV) or COS-7 cells overexpressing CYRIWT or CYRI-BR160/161D after doxycycline induction. One-way ANOVA with Dunn’s post-test was performed. n.s. p> 0.05, *** p≤0.001. (EV n=59 ; WT n=62 ; R160/161D n=63 cells).
Data represent at least 3 biologically independent experiments.
Bar and scatter plots show data points with mean and S.E.M.
Whisker plots show 10-90 percentile, median (bar) and mean (cross).

