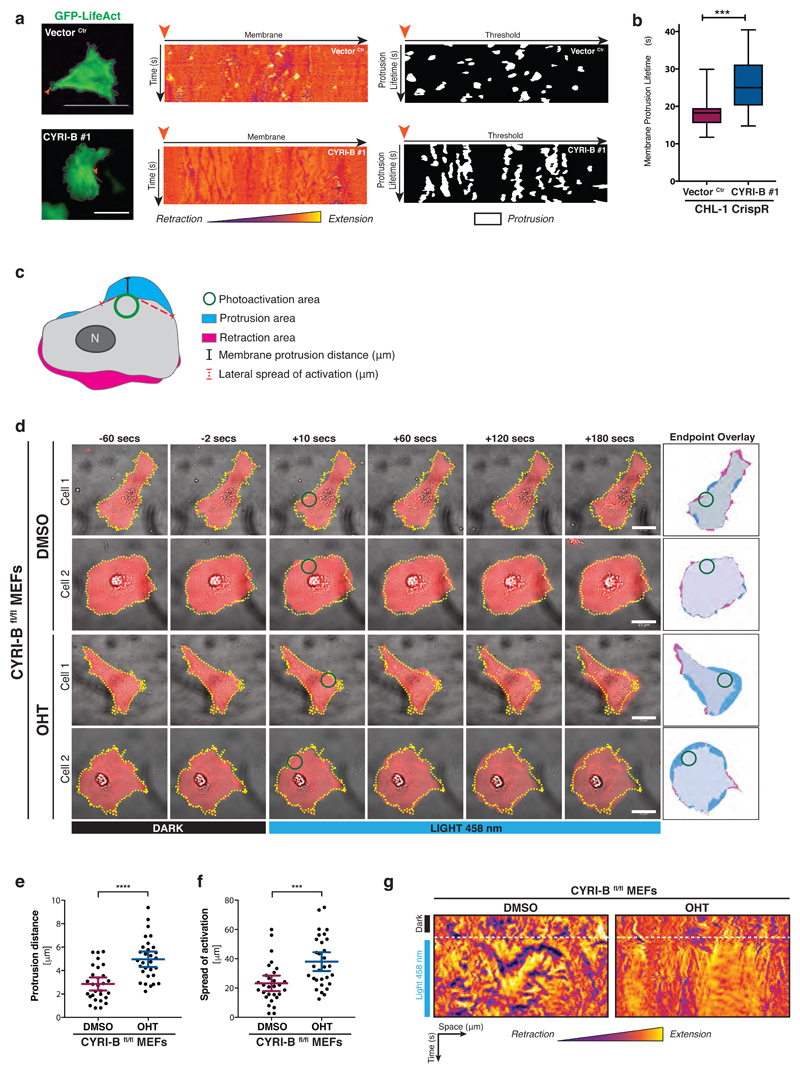
Figure 5. CYRI-B controls the duration and extent of Rac1-mediated protrusions.
a - Control (Vector Ctr) and cyri-b CrispR knockout CHL-1 cells on laminin expressing GFP-LifeAct, recorded for 3 minutes at 1 frame/sec. The cell periphery (magenta) is tracked using the GFP-LifeAct signal (green) (Left panel). The membrane is unravelled from the orange arrow and a representative polar kymograph of the changes in membrane dynamics over time between control (Vector Ctr - Top) and cyri-b CrispR knockout (Bottom) CHL-1 cells is shown. Membrane extensions (positive values) are visualised in yellow through to orange, while retractions (negative values) are purple-blue (Middle panel). Thresholding of the kymograph to remove noise (values ≥ + 0.6) reveals protrusions over time (white signal – Right panel)
Still from movie S2. Scale bar = 25 μm.
b - Box plot representing the distribution of the average protrusion lifetime for each individual cell. Error bars represent S.D. Mann Whitney test was performed. *** p≤0.001. (20 cells/condition)
c - Schematic representation showing protruding (blue) and retracting (magenta) area following photoactivation of Rac1-LOV probe. Photo activation area (green circle) was used as the origin to measure the maximal protrusion distance (outward - black line) and the longest uninterrupted lateral spread of the protrusion (red dotted line)
d - Still pictures from videos of photoactivation time course showing selected cells from DMSO (Control) or OHT-treated (knockout) immortalized CRE-ERT2+ Cyri-Bfl/fl MEFs on fibronectin. Endpoint overlay as from schematic (c). Scale bar = 25 μm.
e-f - Quantification of the protrusion distance (e) and the spread of activation (f) between control (DMSO) or cyri-b knockout (OHT) MEFs.
Error bars represent 95% CI. Unpaired two-tailed t-test (e) and Mann-Whitney test (f). *** p≤0.001, **** p≤0.0001. (DMSO n=29 ; OHT n=30 cells).
g - Kymograph representation before and after photo activation. Membrane extensions are visualised in yellow through to orange, while retractions are observed in purple-blue. Time of photoactivation is highlighted by a white dotted line.
All data presented are representative of at least 3 biologically independent experiments.

