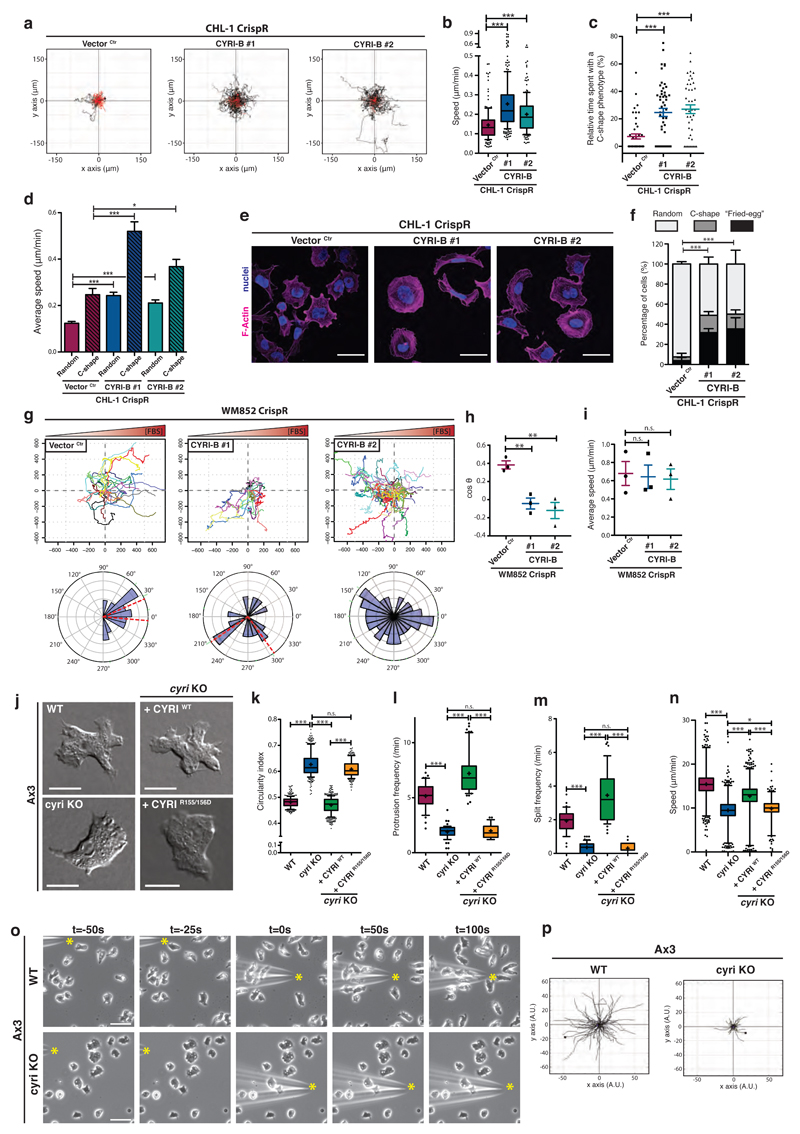
Figure 6. CYRI proteins mediate plasticity of protrusions needed for directional migration.
a-b - Spider plots of control (Vector Ctr) or cyri-b CrispR knockout (#1 and #2) CHL-1 cells on collagen-I-coated dishes and recorded for 17h (a) (See movie S4). Black and red lines represent tracks with a travelled distance greater or shorter than 100 μm respectively. Average speed is plotted in (b). Whisker plots show 10-90 percentile and mean (cross). One-way ANOVA with Dunn’s post-test *** p≤0.001. (Ctr n=161 ; #1 n=228, #2 n=178 cells).
c - Relative time spent with a fast moving C-shape phenotype between control (Vector Ctr) and cyri-b CrispR knockout (#1 and #2) CHL-1 cells. One-way ANOVA with Dunn’s post-test *** p≤0.001. (Ctr n=45 ; #1 n=53, #2 n=42 cells).
d - Speed of control (Vector Ctr) or cyri-b CrispR knockout (#1 and #2) CHL-1 cells displaying a random or a C-shape. One-way ANOVA with Dunn’s post-test n.s. p>0.05, * p≤0.05, *** p≤0.001. (Ctr n=45 ; #1 n=53, #2 n=42 cells)
e-f - Immunofluorescence of control (Vector Ctr) or cyri-b CrispR knockout (#1 and #2) CHL-1 cells on collagen and stained for F-actin (magenta) and nuclei (blue) (e). Scale bar = 50 μm. Cells were classified into 3 categories according to their morphology (Fried-egg, C-shape, Random) and the percentage of each population is shown in (f). Two-tailed Chi-square test (95% confidence). *** p≤0.001. (Ctr n=276 ; #1 n=216, #2 n=210 cells)
g-i - Spider plots and rose plots representing the chemotactic ability of control (Vector Ctr) or cyri-b knockout WM852 cells migrating toward 10% FBS (g) (see movie S5). Red-dashed lines represent a 95% confidence interval for the mean direction. Cosθ (chemotactic index) (h) and average speed (i). Two-tailed unpaired t-test. n.s. p>0.05, ** p≤0.01. (Ctr n=129 ; #1 n=132, #2 n=151 cells).
j-n - Representative DIC pictures from an under agarose chemotaxis assay of Ax3 (WT) and Ax3-derived cell lines (j) (see movie S6). Scale bar = 10 μm. Automatic cell segmentation and tracking used to quantify cell circularity (k), protrusions and split frequency (l and m respectively), and speed (n). Whisker plots show 10-90 percentile (k-m) and 1-99 percentile (n) with median (bar) and mean (cross). One-way ANOVA with Dunn’s post-test was performed. n.s. p>0.05, * p≤0.05, *** p≤0.001. (Cell counts: k: WT n=360 ; cyri KO n=352 ; cyri KO + CYRI WT n=480 ; cyri KO + CYRI R155/156 n=240 - l: WT n=45 ; cyri KO n=57 ; cyri KO + CYRI WT n=53 ; cyri KO + CYRI R155/156 n=31 - m: WT n=42 ; cyri KO n=62 ; cyri KO + CYRI WT n=46 ; cyri KO + CYRI R155/156 n=33 - n: WT n=2389 ; cyri KO n=2460 ; cyri KO + CYRI WT n=3024 ; cyri KO + CYRI R155/156 n=1169)
o-p - Needle assay using WT or cyri knockout Ax3 cells migrating toward cAMP. Time-lapse phase contrast movies (see movie S8) of cells responding to cAMP (yellow start). Scale bar = 25 μm (o). Spider plots obtained from manual tracking of the first 100 seconds following needle re-orientation (p). (WT n=86 ; cyri KO n=79 cells)
All data presented are representative of at least 3 biologically independent experiments.
Bar and scatter plots show data points with mean and S.E.M.

