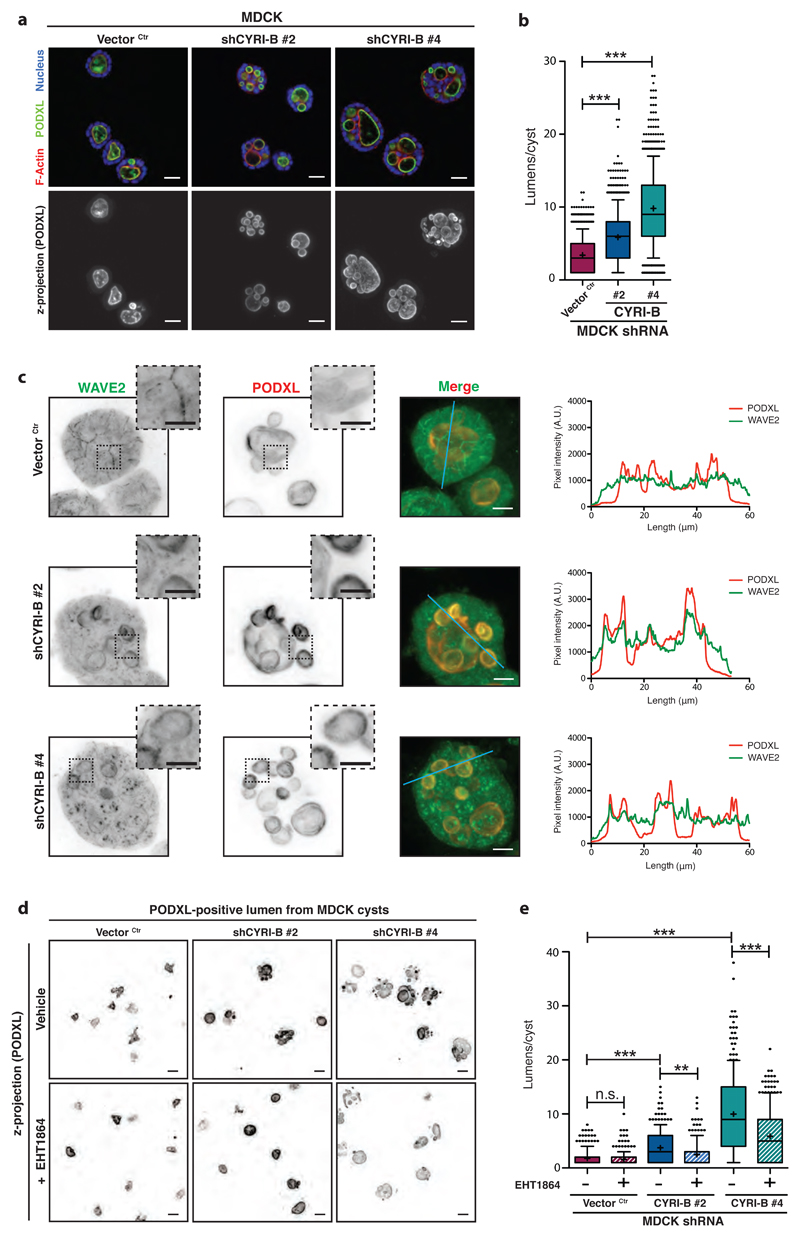
Figure 7. CYRI-B regulates Rac1-dependent recruitment of Scar/WAVE complex during epithelial cystogenesis.
a-b – Immunofluorescence of control (Vector Ctr) or cyri-b shRNA knockdown (#1 and #2) MDCK cysts fixed after 5 days of culture and stained for Podocalyxin (PODXL) (green), F-actin (red) and nuclei (blue). Top row is a confocal section and bottom row represents Z-maximal projection intensity of PODXL staining. Scale bar = 50 μm (a). Quantification of lumens in (b). One-way ANOVA with Dunn’s post-test. *** p<0.001. (Ctr n=1000, #1 n=1000, #2 n=800 cysts).
c - Immunofluorescence of control (Vector Ctr) or cyri-b shRNA knockdown (#1 and #2) MDCK cysts stained for WAVE2 (green) and Podocalyxin (PODXL) (red) after 5 days of culture. Inverted LUT images, merge and representative surface profile plots shown. PODXL (red) and WAVE2 (green) staining intensity was measured along the blue line. Scale bar = 9 μm. Insets provide a magnified view of the dotted square area. Scale bar = 5 μm.
d-e – Immunofluorescence of control (Vector Ctr) or cyri-b shRNA knockdown (#1 and #2) MDCK cysts grown during 5 days, treated or not with 50 nM EHT1864 and stained for Podocalyxin (PODXL). Pictures represent the Z-maximal projection intensity from a representative z-stack running across the entire cyst volume. Scale bar = 50 μm (d). Number of lumens per cyst was quantified for vehicle or EHT1864-treated cysts and plotted in (e). One-way ANOVA with Dunn’s post-test was performed between control (Vector Ctr), shCYRI-B #1 and shCYRI-B #2 whereas unpaired two-tailed t-test was applied between vehicle and drug-treated cyst. n.s. p>0.05, ** p≤0.01 *** p≤0.001. (250 cysts/condition)
All data presented are representative of at least 3 biologically independent experiments.
Bar and scatter plots show data points with mean and S.E.M.
Whisker plots show 10-90 percentile, median (bar) and mean (cross).

