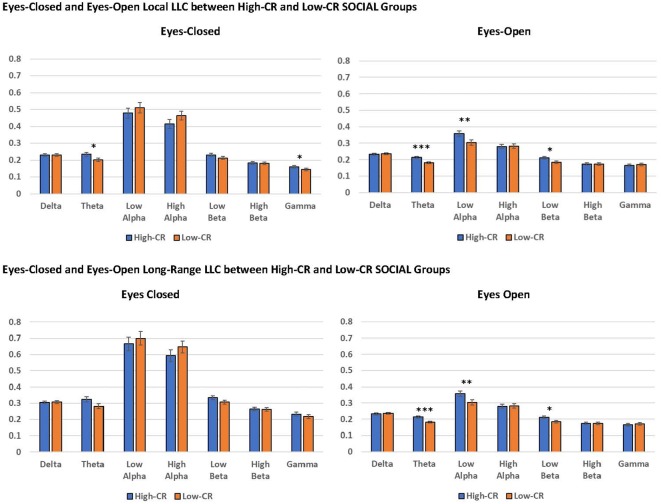
Figure 4.
The high-CR-SOCIAL group exhibited greater eyes-open local LLC values in theta (p < 0.001) and low alpha (p = 0.005), than the low-CR-SOCIAL group. Additionally, the high-CR-SOCIAL group exhibited greater long-range LLC values for theta (p < 0.001) and low alpha (p = 0.006) than the low-CR-SOCIAL group. LLC values are reported as square root transformed and error bars reflect one standard error of the mean. *p < 0.05, **p < 0.01, ***p < 0.001.

