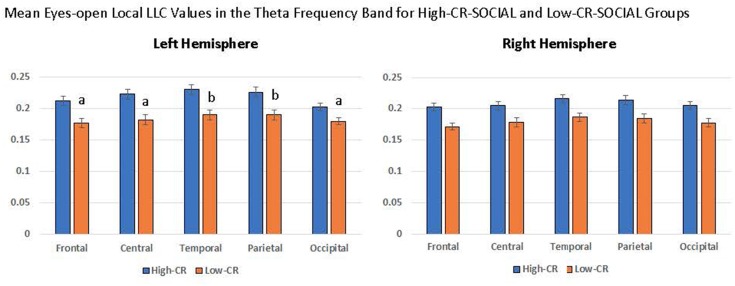
Figure 5.
High-CR-SOCIAL participants consistently exhibited higher eyes-open local LLC values than low-CR-SOCIAL for the theta frequency band. The distribution of LLC values within CR groups differed in the left hemisphere for low-CR-SOCIAL but not high-CR-SOCIAL participants. Low-CR-SOCIAL participants displayed higher local LLC values over the temporal and parietal regions when compared to the frontal region (p < 0.001), central region (p < 0.01), and occipital region (p < 0.001). Local LLC values in the left temporal and parietal regions did not differ from each other (p > 0.05). Error bars indicate one standard error of the mean and all LLC values are reported as square-root transformed. All ‘a’ conditions differed significantly from ‘b’ conditions but did not differ significantly from other ‘a’ conditions. Similarly, ‘b’ conditions differed significantly from ‘a’ conditions but not from each other.

