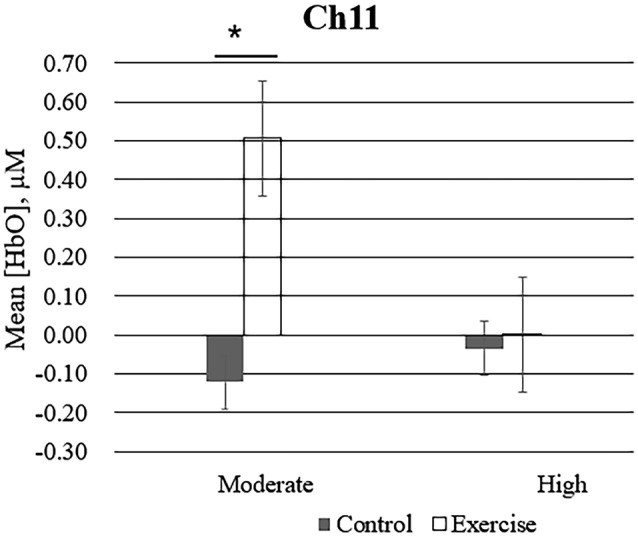
Figure 4.

Mean changes in oxyhemoglobin concentration (HbO) for channel 11 (Ch11) as participants in the exercise and control groups view images of high-calorie foods grouped by exercise intensity. Bars represent participant means, and vertical lines represent standard errors of the mean; *P = 0.02.
