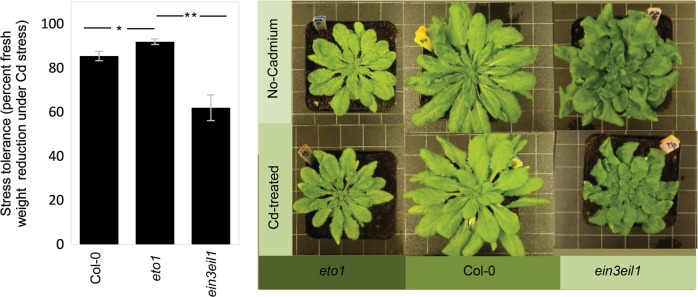
Fig. 3.
Cadmium stress tolerance in Col-0, eto1, and ein3eil1 genotypes growing in 50 µM cadmium compared with a no-cadmium treatment. ein3eil1 mutant showed 38% reduction in dry weight compared with 14% reduction in Col-0, and 9% in eto1. The Differences between Col-0, eto1, and ein3eil1 genotypes were analyzed by two-way ANOVA of plants and cadmium treatment (0 and 50 µM) (Table S2). Significant effects are shown by asterisks (*p < 0.05, **p < 0.01). Error bars show ± SE. The numbers of replicates were 8

