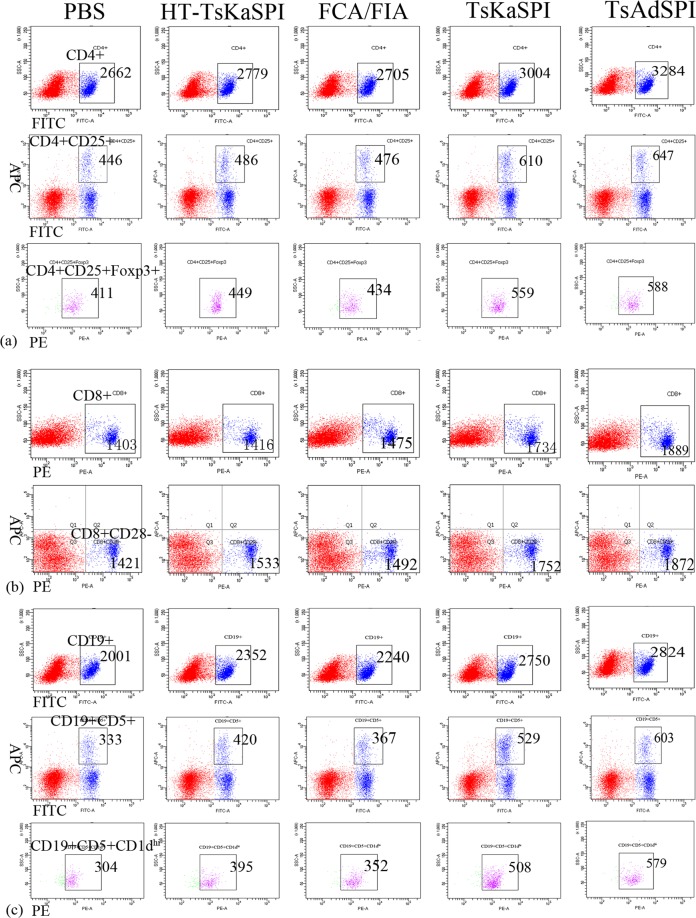
Figure 2.
Demonstration of the gating strategy for the flow cytometric analysis of mouse CD4 CD25+Foxp3+ Treg (a), CD8+CD28− T cell (b), CD19+CD5+CD1dhi Breg (c) from spleen. In this experiment a single cell suspension was prepared from the spleen of each group and stained with CD4 (FITC), CD25 (APC), Foxp3 (PE), CD8 (PE), CD28 (APC), CD19 (FITC), CD5 (APC), CD1d (PE) based on surface and intracellular staining protocols, respectively. Data were collected with FACSDiva flow cytometer and analyzed. Lymphocytes are identified by their scatter properties (FSC-A × SSC-A plot).

