Figure 8.
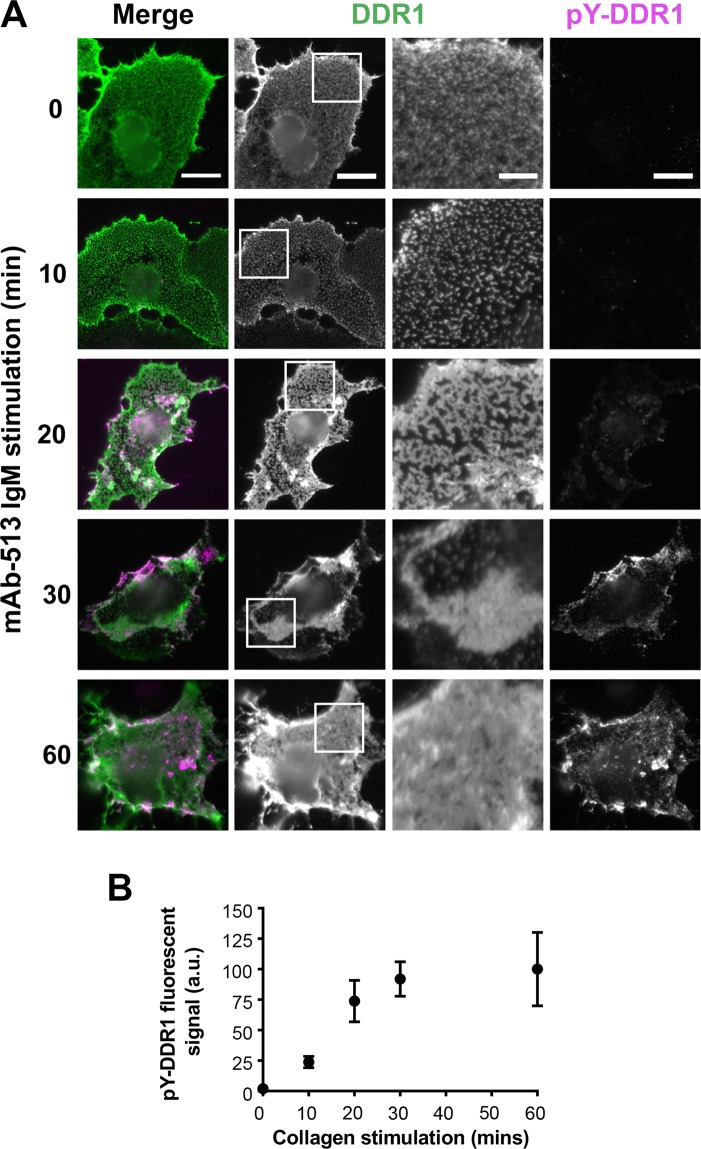
mAb-513-induced DDR1 redistribution and phosphorylation. (A) COS-7 cells transiently expressing DDR1 were either incubated with mAb-513 IgM for the indicated times at 37 °C or left unstimulated, then incubated on ice with anti-DDR1 mAb 7A9, before fixation, permeabilisation and immunostaining for phospho-tyrosine 513 (pY-DDR1). Cells were imaged using a widefield microscope. White boxes in DDR1 images indicate corresponding areas shown at higher magnification in images to the right. Scale bars, 30 μm or 10 μm (magnification). (B) Cells were treated and imaged as above. Mean pY-DDR1 signal for each cell was calculated and averaged for the stimulation time. Values were normalised so that the mean value for 0 and 60 minutes was 0 and 100 A.U respectively. Error bars are SEM. N = 15–23.

