Figure 4.
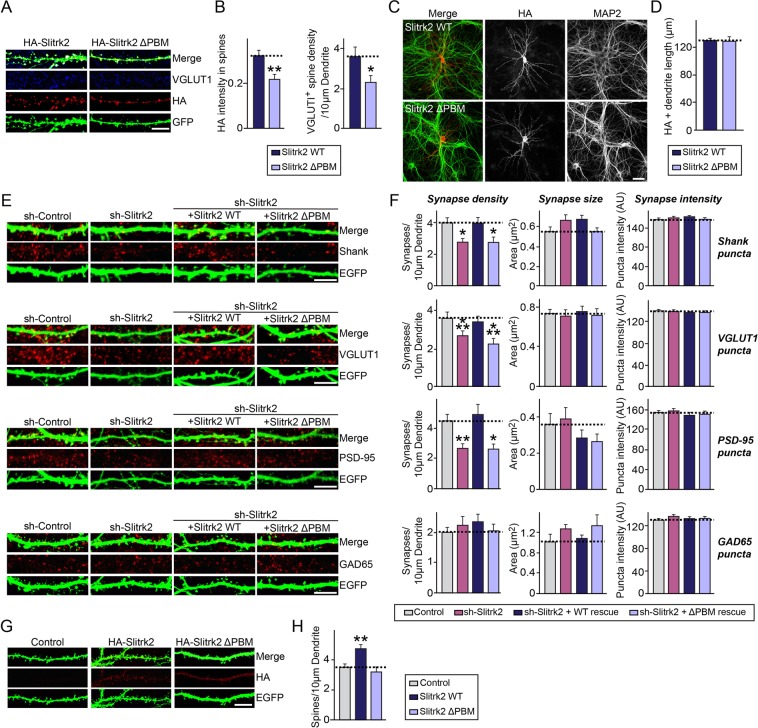
Slitrk2 promotes excitatory synapse development through its C-terminal PDZ interactions in cultured hippocampal neurons. (A) Representative images of cultured hippocampal neurons transfected at DIV10 with Slitrk2 constructs (Slitrk2 WT or Slitrk2 ΔPBM). Neurons were analyzed by triple-immunofluorescence labeling for VGLUT1 (blue), HA (red), and MAP2 (green) at DIV14. Scale bar, 10 μm (applies to all images). (B) Summary bar graphs showing the intensity of HA immunofluorescence-positive spines (left) and the number of VGLUT1 immunofluorescence-positive spines (right). Data are presented as means ± SEMs from three independent experiments (n = 22–30 neurons; *p < 0.05, **p < 0.01 vs. control; non-parametric Mann-Whitney U test). (C) Representative images of cultured hippocampal neurons transfected at DIV10 with Slitrk2 constructs (Slitrk2 WT or Slitrk2 ΔPBM). Neurons were analyzed by double-immunofluorescence labeling for HA (red) and MAP2 (green) at DIV14. Scale bar, 20 μm (applies to all images). (D) Summary data for lengths of HA immunofluorescence-positive dendrites. Data are presented as means ± SEMs from three independent experiments (n = 22–30 neurons; non-parametric Mann-Whitney U test). (E) Cultured hippocampal neurons were transfected with a lentiviral vector expressing sh-Control, sh-Slitrk2, or coexpressing sh-Slitrk2 and shRNA-resistant Slitrk2 expression vectors (Slitrk2 WT or Slitrk2 ΔPBM) at DIV8 and analyzed at DIV14 by double-immunofluorescence staining for EGFP (green) and the indicated synaptic markers (Shank, VGLUT1, PSD-95 or GAD65; red). Scale bar, 10 μm (applies to all images). (F) Summary data showing the effects of Slitrk2 KD on synaptic puncta density (left) and synaptic puncta size (right), measured using Shank, VGLUT1, PSD-95, and GAD65 as synaptic markers. More than three dendrites per transfected neuron were analyzed and group-averaged. Data are presented as means ± SEMs from three independent experiments (n = 22–30 neurons; *p < 0.05, **p < 0.01, ***p < 0.001 vs. control; non-parametric ANOVA with Kruskal-Wallis test followed by post hoc Dunn’s multiple comparison test). (G) Representative images of cultured hippocampal neurons transfected at DIV10 with EGFP alone (Control) or together with Slitrk2 constructs (Slitrk2 WT or Slitrk2 ΔPBM). Neurons were analyzed by double-immunofluorescence labeling for HA (red) and EGFP (green) at DIV14. Scale bar, 10 μm (applies to all images). (H) Summary data showing the effects of Slitrk2 overexpression in neurons on dendritic spine density. Data are presented as means ± SEMs from three independent experiments (n = 22–30 neurons; **p < 0.01 vs. control; non-parametric ANOVA with Kruskal-Wallis test followed by post hoc Dunn’s multiple comparison test).

