Figure 3.
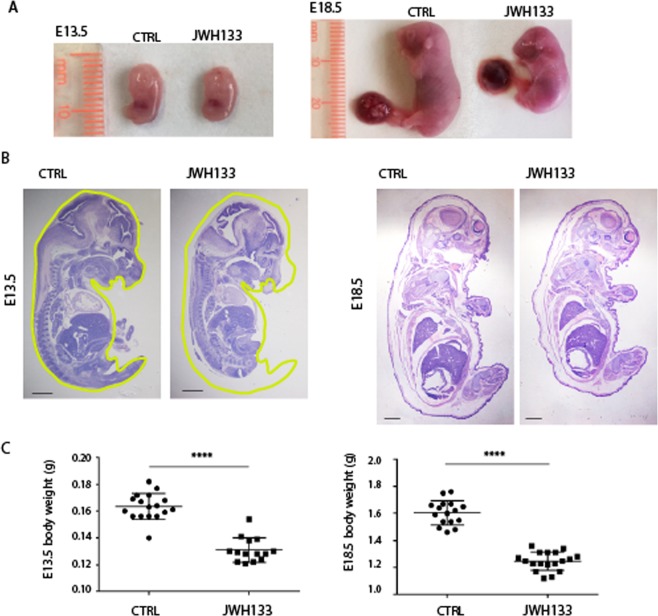
Growth defects in embryo sired from JWH-133 exposed father. (A) Representative images of E13.5 and E18.5 embryos from JWH-133 exposed and control (CTRL) fathers. (B) Histological sections (H&E staining) of E13.5 and E18.5 embryos from JWH-133 exposed and control (CTRL) fathers, displaying a reduced embryo size without developmental abnormalities. The outline of the CTRL embryo is traced in yellow and transferred in JWH-133 embryo to illustrate and compare the overall size between the two embryos. (C) Embryo body weight at E13.5 (130.0 ± 9.14 mg in JWH-133 vs 163.4 ± 9.84 mg in CTRL) and E18.5 (1.25 ± 0.07 g in JWH-133 vs 1.60 ± 0.09 g in CTRL). Scatter plots show the results of n = 15–18 embryos randomly selected from n = 3 females from each group. ****P < 0.0001. Scale bar: 1 mm in B.

