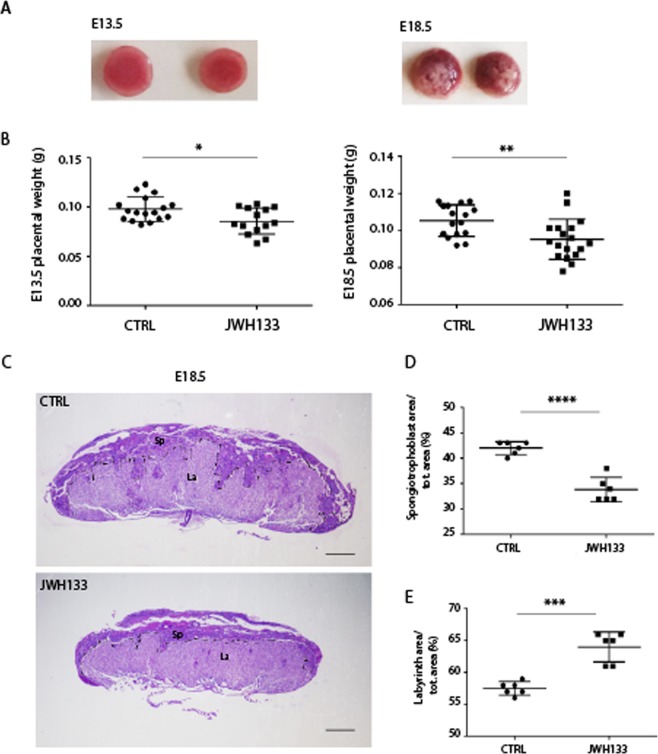
Figure 4.
Placental abnormalities in pregnancies sired by a JWH-133 treated father. (A) Representative images of E13.5 and E18.5 placentas from JWH-133 exposed and control (CTRL) fathers. (B) Scatter plots of placental weight at E13.5 and E18.5 from JWH-133 exposed and control (CTRL) fathers showing a significant reduction in those from treated males (E13.5: 85.71 ± 13.20 mg in JWH-133 vs 97.82 ± 12.22 mg in CTRL; E18.5: 95.22 ± 10.87 mg in JWH-133 vs 105.3 ± 8.48 mg in CTRL). Scatter plots show the results of n = 15–18 placentas randomly selected from n = 3 females from each group. *P < 0.05; **P < 0.01. (C) Histology of E18.5 placenta cross-sections from fetus sired by CTRL or by JWH-133 father stained with PAS. The spongiotrophoblast (Sp) and the labyrinth (La) are outlined manually showing a thinner Sp layer in the placenta from JWH-133 treated male. (D) Scatter plot of the ratio of Sp/total area in placentas from CTRL and JWH-133 male (33.83% ± 2.401 in JWH-133 vs 42.00% ± 1.265 in CTRL) (E) Scatter plot of the ratio of La/total area in placenta from CTRL and JWH-133 male (64.00% ± 2.366 in JWH-133 vs 57.50% ± 1.049 in CTRL). The areas were measured by using five sections for each placenta. Scatter plots show the results of n = 6 placentas randomly selected from each group. ***P < 0.001; ****P < 0.0001. Scale bar: 1 mm in C.

