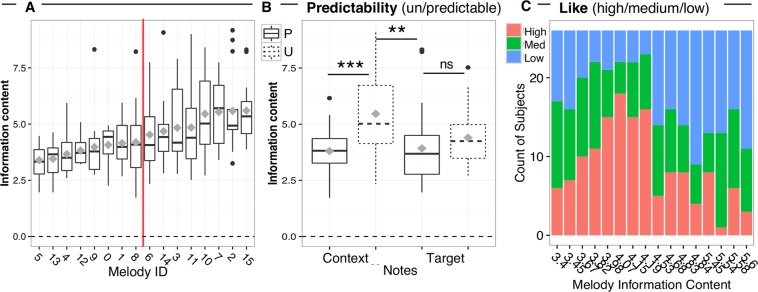
Figure 5.
Stimuli. Median information content (A) for each melody, (B) for context and target notes of predictable (P) vs. unpredictable (U) melodies. Box = 25th and 75th percentile; bars = min and max values. Grey squares = mean information content across notes. The red vertical line indicates the median split of melodies based on their mean information content (C) Stack bar chart with the counts of high, medium and low liking ratings assigned by subjects to each melody (on the x axis ordered by increasing mean IC values).

