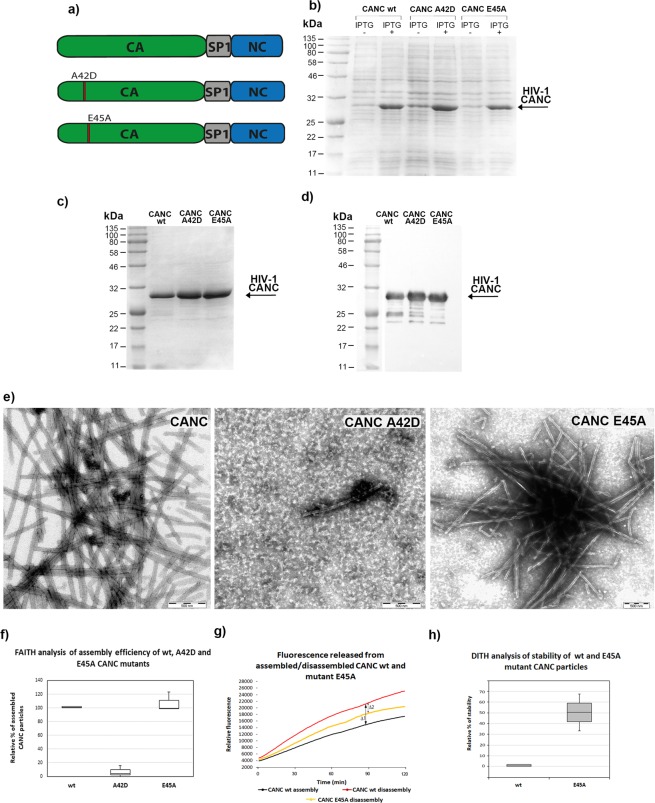
Figure 4.
Expression and purification of HIV-1 A42D and E45A CANC mutants and assembly/disassembly analysis. (a) Schematic representation of the A42D and E45A mutations introduced within the CA domain of HIV-1 CANC. (b) Coomassie Brilliant Blue-stained SDS polyacrylamide gels showing the expression of wt HIV-1 CANC and the A42D and E45A CA mutants. (c) Coomassie Brilliant Blue-stained SDS polyacrylamide gel and (d) Western blot analysis of purified wt HIV-1 CANC and the A42D and E45A CA mutants. Colour prestained protein marker (NEB) was visualized by a digital camera in bright field (Fig. S2a), HIV-1 CANC proteins in chemiluminescent mode (Fig. S2b). (e) TEM analysis of negatively stained wt HIV-1 CANC and the A42D and E45A CA mutants assembled in the presence of tqON in assembly buffer. (f) FAITH quantification of wt HIV-1 CANC and CA mutant assembly in the presence of tqON. (g) Fluorescence emission curves demonstrating the kinetics of tqON release from preassembled wt and E45A CANC particles incubated in assembly buffer (black curve) and disassembly buffer (red and yellow curves, respectively). The relative stabilization was calculated as the difference between the relative fluorescence of tqON at 90 min in the disassembly and assembly reactions according the calculation: relative percent of stabilization = 100 * Δ2/Δ1. (h) DITH quantification of the relative stability of preassembled wt and E45A CANC particles incubated in the disassembly buffer measured and calculated as described in (g). Relative stability of wild type in disassembly buffer was considered as 0%.

