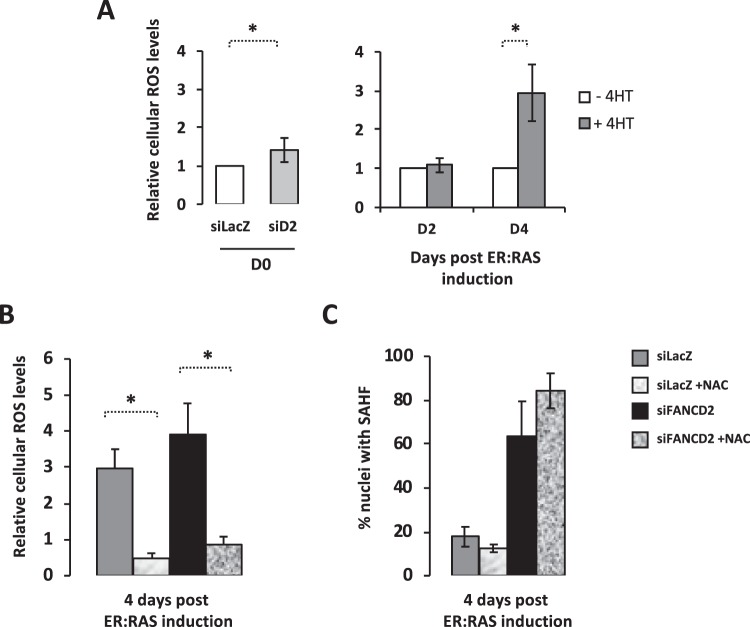
Figure 3.
Higher ROS in FANCD2-deprived cells does not mediate increased SAHF. (A) Histogram presenting the relative intracellular ROS level in FANCD2-proficient and FANCD2-deficient IMR90* cells before oncogene activation (left) and 2 or 4 days after oncogene activation in control cells (right). Bars represent the mean +/− SEM of 3 independent experiments. *p < 0.05. (B) Histogram presenting the relative intracellular ROS level in FANCD2-proficient and FANCD2-deficient IMR90* cells 4 days after oncogene activation in the absence or presence of the NAC (2.5 mM). Bars represent the mean +/− SEM of 3 independent experiments. *p < 0.05. (C) Histogram presenting the frequency of SAHF-positive cells in FANCD2-proficient and FANCD2-deficient IMR90* cells 4 days after oncogene activation in the absence or presence of the NAC (2.5 mM). Bars represent the mean +/− SEM of 3 independent experiments.

