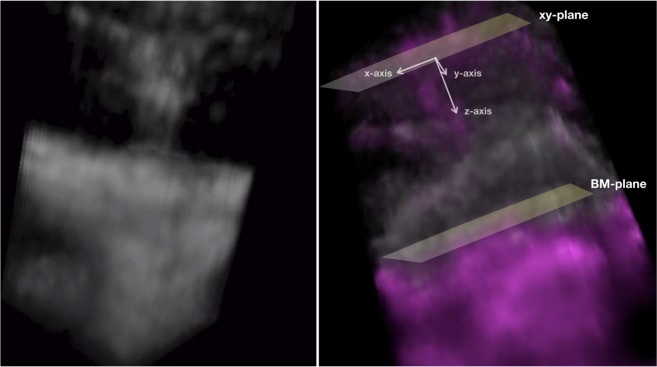
Figure 1.
Frames obtained from rotational 3D visualizations of a type 3 neovascularization. The 3D OCTA visualization (left image) demonstrates the presence of an intraretinal lesion originating from the deep vascular complex and moving toward the outer retinal layers. The merged 3D structural OCT (white signal) and OCTA (magenta signal) visualization (right image) allowed to investigate correlations between flow and structural data. The orientation of type 3 lesions was assessed in relation with the three axes of the three-dimensional Cartesian coordinate system, assuming that the xy-plane passes through the type 3 lesion’s origin and is parallel to the Bruch’s membrane (BM) plane.

