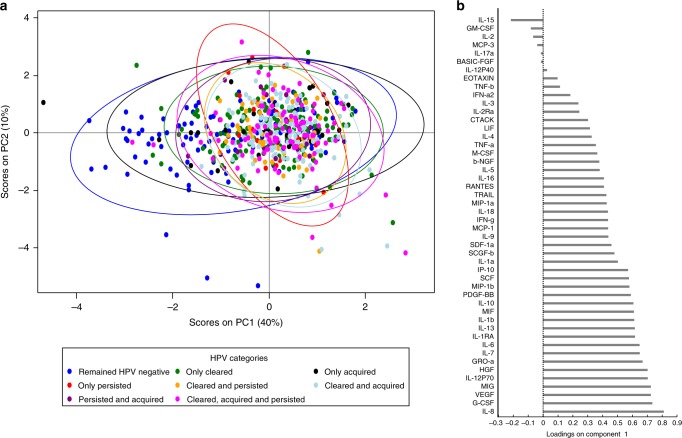
Fig. 6.
Principal component analysis (PCA) of the association between HPV infection and genital cytokines. (a) Principal component (PC) analysis and (b) cytokine loading on PC1 were used to define the relationship between HPV status and genital cytokine concentrations observed between two consecutive visits for all HIV-negative study participants (N = 673 visits). Each dot in the plot represents a participant’s score, which indicates individual standing on each component, and different colors indicate the HPV category of each participant. Participants with higher scores in PC1 are expected to have a higher level of certain cytokines as those load higher in PC1; e.g. IL-8

