Figure 4.

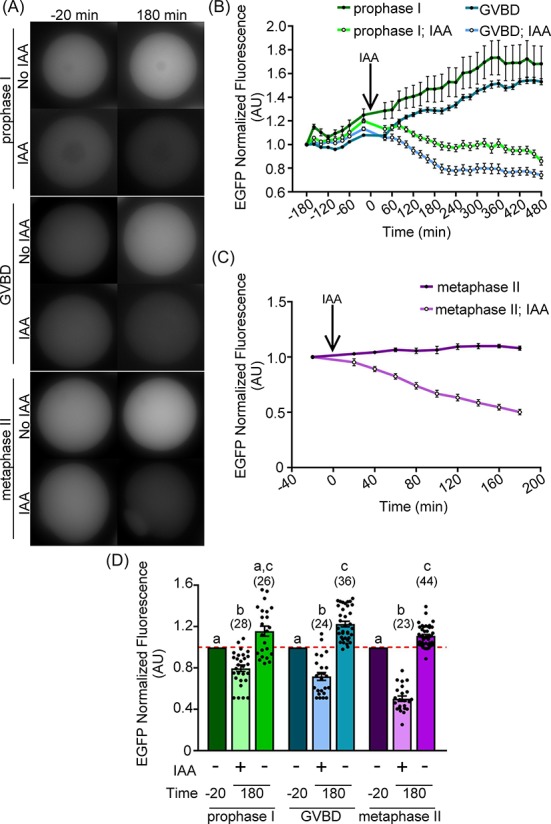
Auxin-inducible degradation works during meiosis I and at metaphase II (MII) arrest. Oocytes were injected with 0.4 μg/μl AIDm-EGFP cRNA and 2.0–2.2 μg/μl TIR1-myc cRNA, and allowed to express cRNA for 3 h prior to imaging and initiation of meiotic maturation (GVBD oocytes). (A) Live-cell EGFP fluorescence (gray) in oocytes 20 min prior to (−20 min) and 180 min after IAA addition. (B, C) Graphical representation of EGFP fluorescence over time in prophase I, GVBD (B), or MII (C) oocytes. IAA was added at a concentration of 500 μM at t = 0 min (arrow). EGFP fluorescence normalized to expression at −180 min (prophase I and GVBD) or −20 min (MII). (D) Graphical comparison of EGFP fluorescence before (−20 min) and after (180 min) IAA addition. EGFP fluorescence normalized to expression at −20 min (Kruskal–Wallis test with Dunn's post hoc). n = number of oocytes analyzed (23–44 over three technical replicates), P < 0.0001. Line graphs show mean and SEM of EGFP fluorescence every 20 min. Bar graph shows mean, SEM, and individual oocyte scatter plot.
