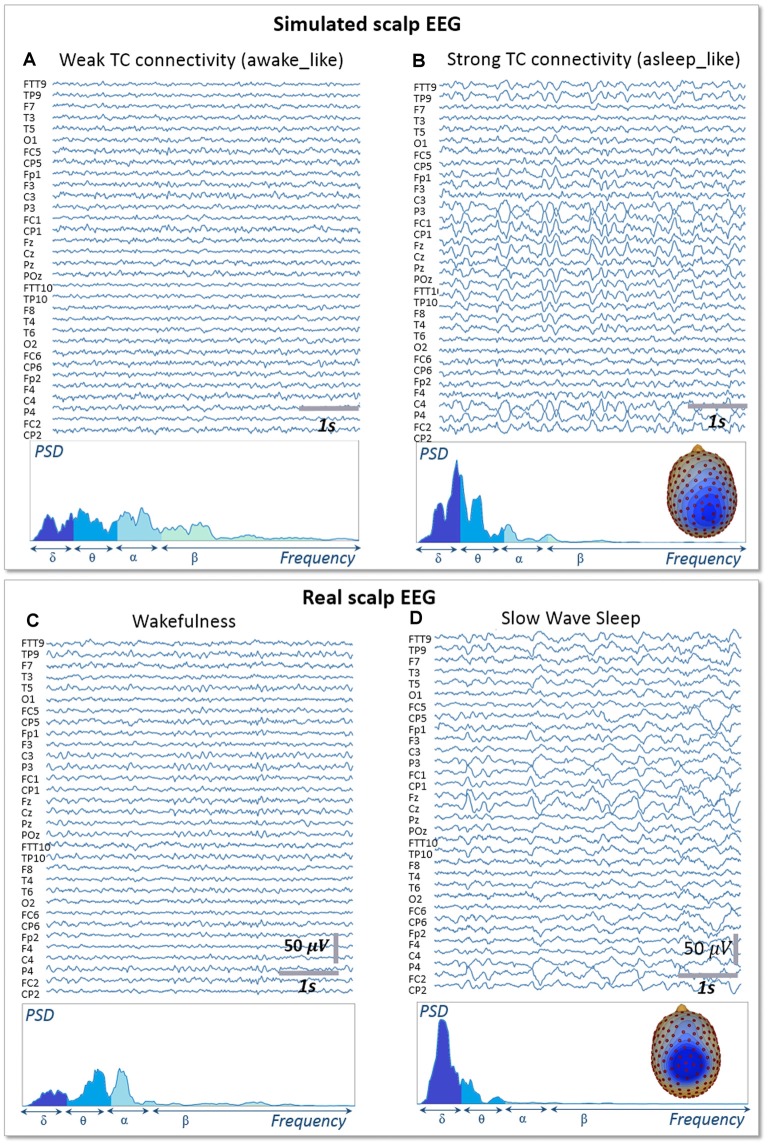
Figure 5.
Simulated vs. Real EEG during wakefulness and SWS. Signals simulated with the whole-brain model using weak thalamo-cortical connectivity parameters (A) display background activity. The morphology and spectral content of these simulated signals are similar to scalp EEG recorded in a human subject during wakefulness in humans (C), except for a higher power spectral density in the beta sub-band. Signals simulated with the whole-brain model using strong thalamo-cortical connectivity parameters (B) display delta waves similar to the activity recorded in real condition during SWS in humans (D). The spectral content of signals as well as the topographical voltage distribution at the peak of delta waves were similar in the simulated and real conditions.

