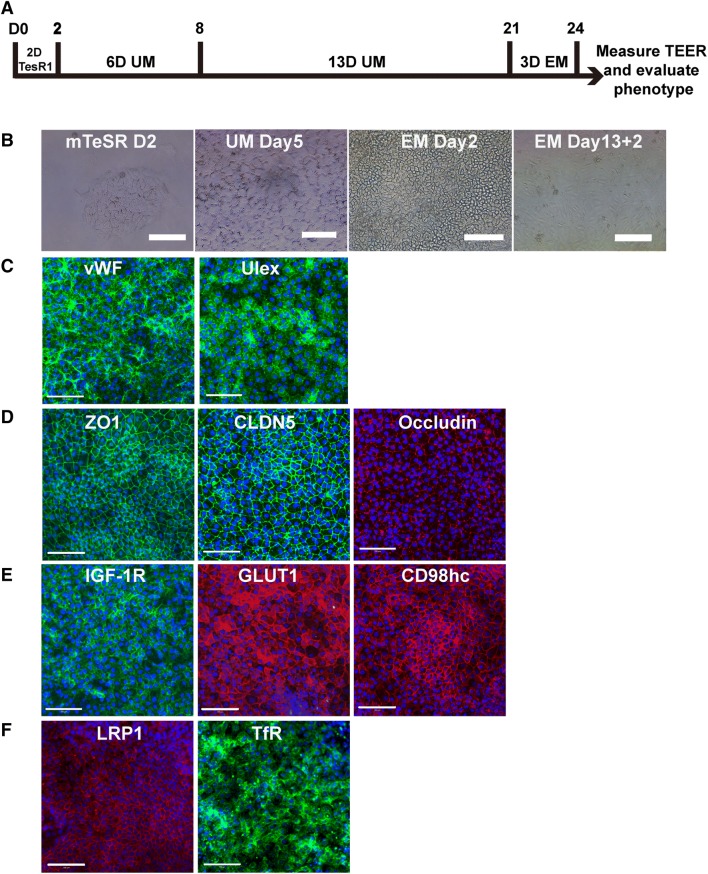
Fig. 1.
Differentiation and characterization of hiPSC-derived endothelial cells (ECs). A Schematic of the differentiation process. B Phase-contrast images of hiPSC cells at different differentiation stages, including 2 days in mTeSR, after 5 days in unconditioned medium culture, after 2 days in EM culture, and after 2 days of sub-culturing. C Expression of EC markers VWF (green) and Ulex (green). D Expression of tight-junction markers ZO-1 (TJP1) (green), claudin-5 (CLDN-5) (green), and occludin (OCLN) (red). E Expression of receptors and transporters IGF-1R (green), GLUT-1 (red), CD98hc (red), LRP1 (red), and transferrin receptor (TfR) (green). Scale bar, 100 μm for B, C, D, and E.

