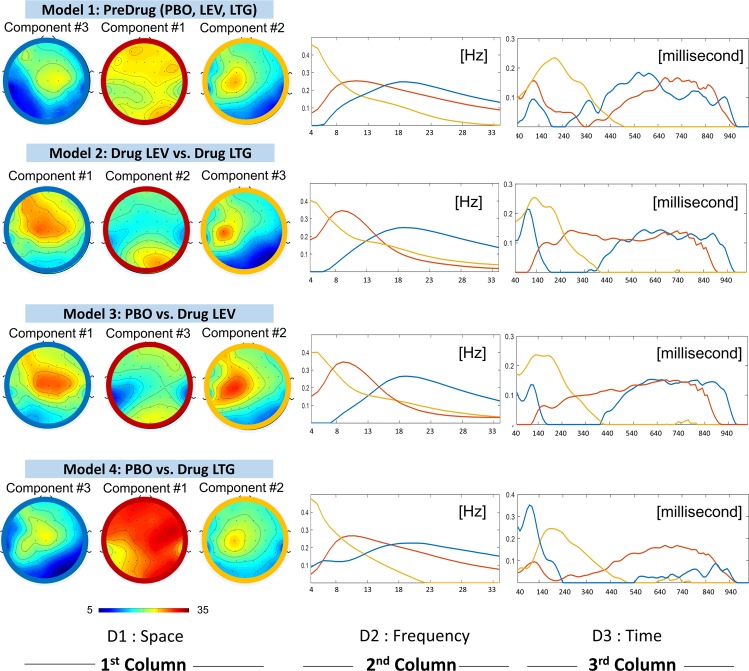
Figure 3.
We present the three components decomposed from 5D tensor in four different models. The top row shows the decomposed components in space (topographical plots), frequency and time dimension. Three colours (blue, red and yellow) are used to indicate the three decomposed components: beta (with peak frequency between 15–30 Hz), alpha (with peak frequency between 6–13 Hz) and theta (with peak frequency between 4–6 Hz), respectively.

