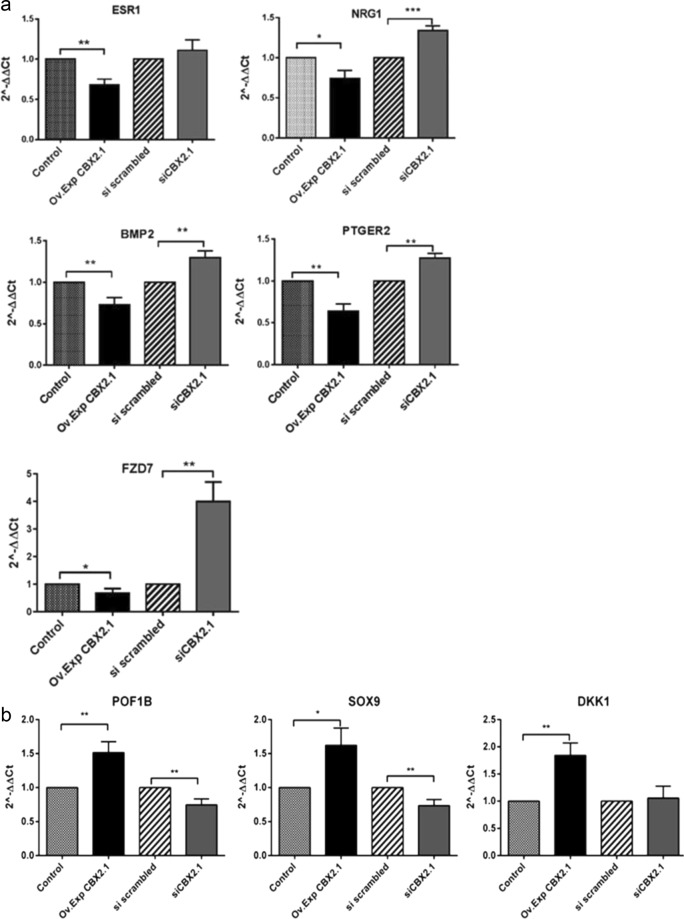
Figure 4.
(a) RT-qPCR analysis of CBX2.1 downstream genes identified by DamID. Relative expression levels (2−ΔΔCt) of the genes were determined after normalization to Glyceraldehyde-3-Phosphate Dehydrogenase (GAPDH). Following CBX2.1 overexpression (Ov Exp. CBX2.1), ESR1, NRG1, BMP2, PTGER2, and FZD7 were found downregulated by CBX2.1 compared to the control set at 1. After silencing the CBX2.1 (si CBX2.1), genes were significantly upregulated except for ESR1 which showed an effect comparable to scrambled sample. All graphs are the average of three independent experiments, error bars represent the standard deviation (SD) from the mean (SEM) and values are expressed as relative to control =1; ***P < 0.001; **P < 0.01 and *P < 0.05. non-significant differences are not indicated. (b) Relative expression levels (2−ΔΔCt) of CBX2.1 related genes. POF1B, DKK1 and SOX9 were upregulated after CBX2.1 forced expression (Ov. Exp CBX2.1). Whereas, when CBX2.1 was silenced (si CBX2.1), SOX9 and POF1B were significantly downregulated. DKK1 did not show any expression change towards the siCBX2.1. All graphs are the average of three independent experiments, error bars represent SD from the mean (SEM), and values are expressed as relative to control =1; ***P < 0.001; **P < 0.01 and *P < 0.05. non-significant differences are not indicated.

