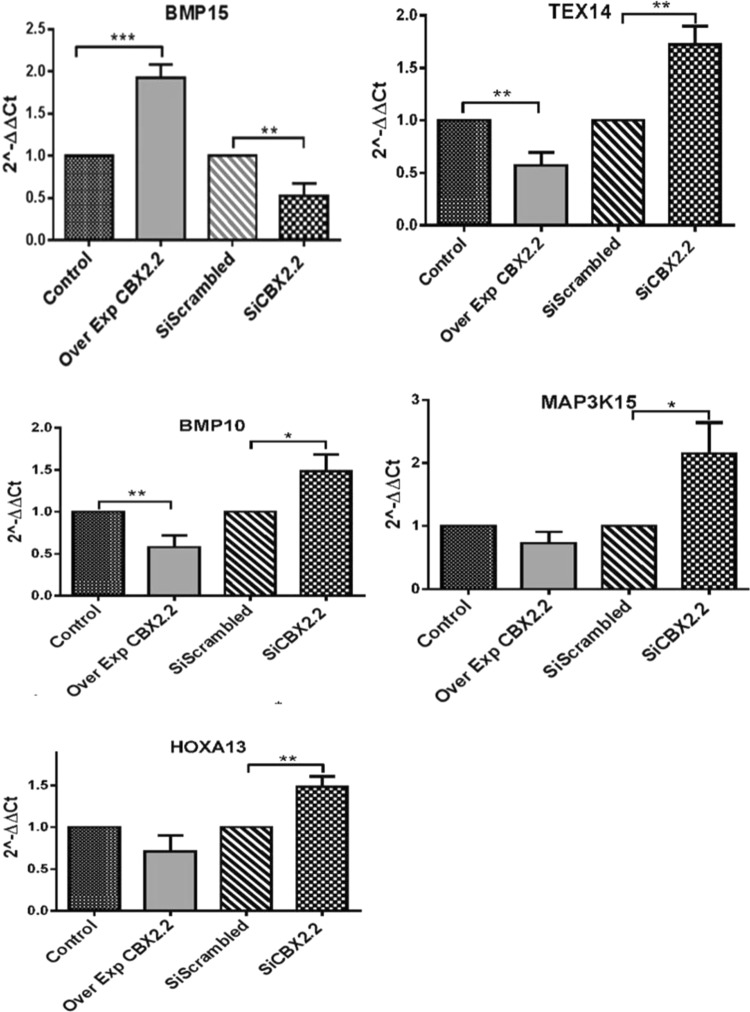
Figure 7.
Relative expression levels (2−ΔΔCt) of the RNA-seq downstream genes of CBX2.2. CBX2.2 forced expression (Over Exp) positively regulated BMP15. Whereas, silencing (si) CBX2.2 (siCBX2.2) resulted in the downregulation of the same gene. Under overexpression (Over Exp) of CBX2.2, the genes TEX14 and BMP10 were significantly downregulated. Expressions of MAP3K15 and HOXA13 were comparable to the control. Silencing CBX2.2 (siCBX2.2) significantly enhanced the genes TEX14, BMP10, MAP3K15 and HOXA13. All graphs are the average of three independent experiments, error bars represent SD from the mean (SEM), and values are expressed as relative to control =1; ***P < 0.001; **P < 0.01; *P < 0.05. non-significant differences are not indicated.

