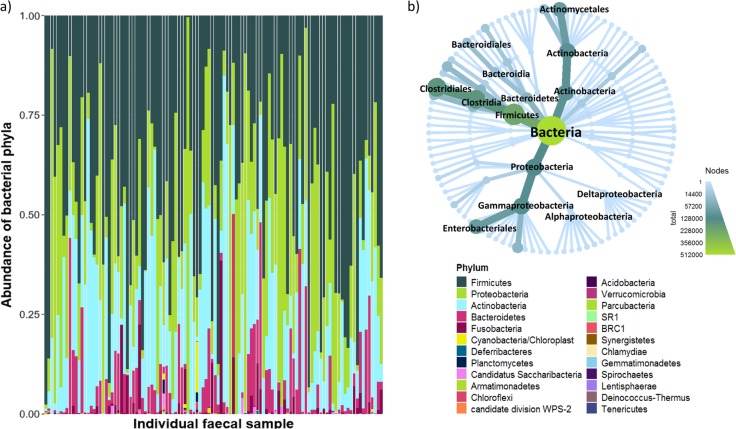
Fig. 2.
a Stacked bar chart of the relative abundance of 25 bacterial phyla in the faecal microbiota of 112 southern Beaufort Sea polar bears. Phyla in the legend are listed in order of decreasing abundance. b Inset is a metacoder heatmap plotted to order level: each node moving from the centre outwards represents a different taxonomic rank, whereby kingdom is the centre and nodes representing order appear on the outer edges. The map is weighted and coloured by read abundance

