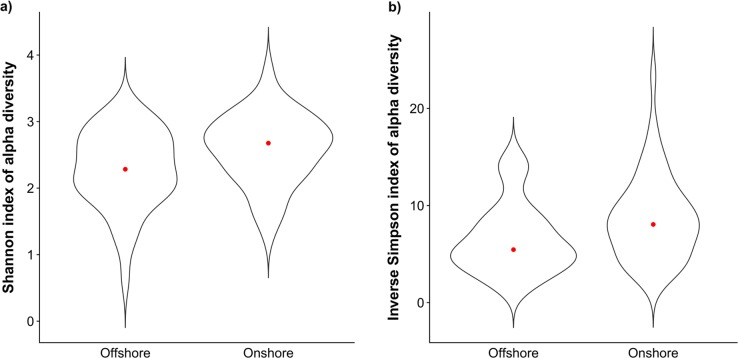
Fig. 3.
Violin plots of alpha diversity within the faecal microbiota of 85 southern Beaufort Sea polar bears for which ‘onshore/offshore’ land use is known (see text for definitions): a Shannon diversity index. b Inverse Simpson diversity index. Violin plots combine a box plot with a density plot, and as such the width of each plot corresponds to the distribution of the data

