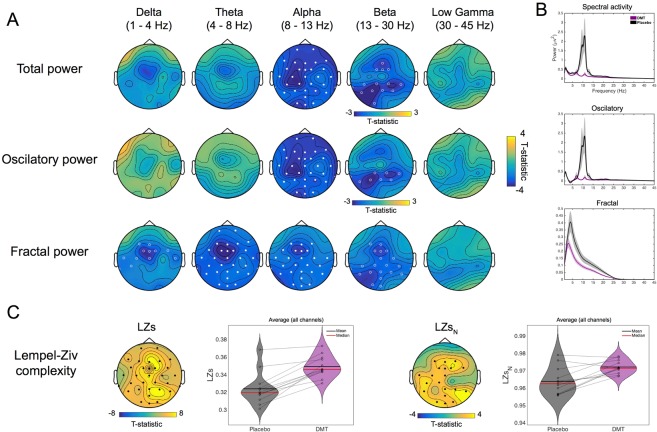
Figure 2.
Time-averaged EEG results. (A) The comparison of DMT versus placebo for changes in spectral activity reveals significant decreases for the alpha and beta bands for conventional spectral power. The decomposed spectra into oscillatory and fractal power, revealed similar results for the former and reductions were seen on all bands < 30 Hz for the latter. Filled circles correspond to clusters p < 0.01 and hollow circles for clusters p < 0.05, N = 12. (B) Grand-average spectral power for DMT and placebo corresponding to spectral, oscillatory and fractal (1/f) components of the signal (N = 12). (C) Increases are seen for both measures of spontaneous signal diversity following DMT administration compared to placebo Filled circles correspond to clusters p < 0.01 and hollow circles for clusters p < 0.05, N = 12 (LZs = Lempel-Ziv complexity, LZsN = normalized LZs).

