Figure 3.
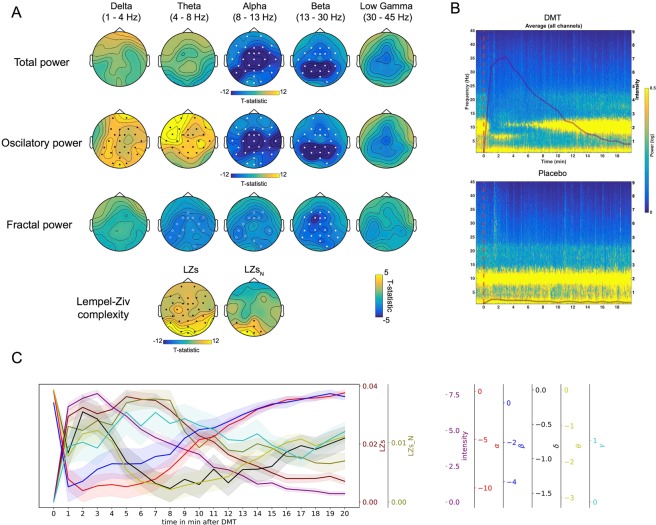
Subjective vs EEG effects across time. (A) Significant inverse relationships were found between real-time intensity ratings and power in alpha and beta bands for all power measures (including the theta band for fractal power). A positive relationship was found between intensity and power at delta and theta bands in the oscillatory component. Increased signal diversity (LZs and LZsN) correlated positively with intensity ratings also. Filled circles/dots correspond to clusters p < 0.01 and hollow circles for clusters p < 0.05, N = 12. Positive relationships are shown using black dots and negative relationships are shown using white dots/circles (B) Time frequency plot illustrating the associations between intensity ratings and spectral activity for DMT and placebo (red line marks beginning of injection), N = 12. (C) Temporal development of intensity, and EEG measures of spectral activity and spontaneous signal diversity (mean ± SEM, N = 12). (δ = delta, θ = theta, γ = gamma, α = alpha, β = beta, LZs = Lempel-Ziv complexity, LZsN = normalized LZs).

