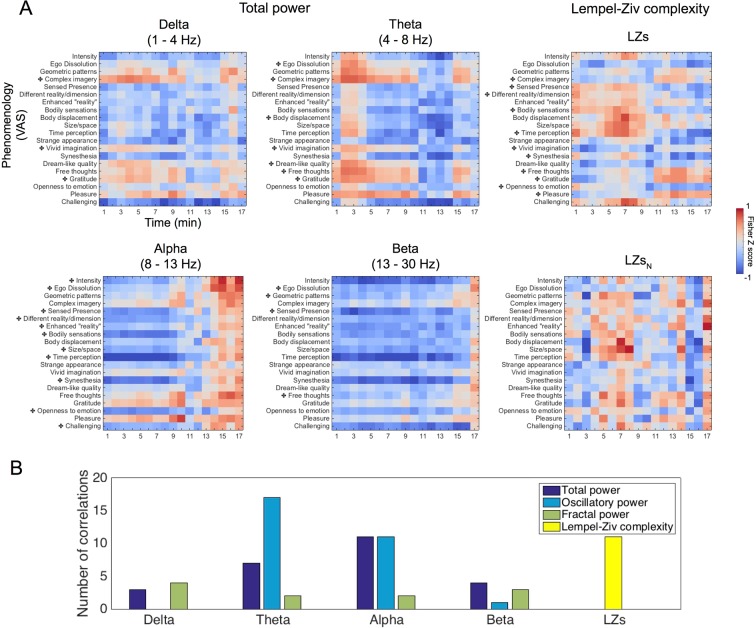
Figure 6.
Psychometric correlational analyses. (A) Normalized correlation coefficient values between VAS items and EEG measures for each minute following DMT. Significant correlations between these normalized correlation values and intensity ratings are marked with a cross following Bonferroni-correction for multiple comparisons at p < 0.05 (see Fig. S3 for correlations with oscillatory and fractal power and Fig. S4 for 5-minute averaged data correlations). (B) Bar chart displaying the number of significant correlations between normalized correlation values (EEG metrics vs VAS items) and intensity ratings. Results revealed that alpha correlate most with subjective experience when the total power is assessed, whereas theta correlates most when just the oscillatory power is extracted. Conversely, fractal power displayed a small amount of significant correlations (See Fig. S6 for the specific correlation values for each item for oscillatory and fractal power). Finally LZs was a metric which displayed the same amount of significant correlations as alpha in total and oscillatory power.

